Table of contents
Part 1 - What is technical analysis in Forex?
Part 2 - How do you read a Forex quote?
Part 3 - Which currency pairs are best for beginners?
Part 4 - DailyFX tools for smarter trading
Part 5 - How does news impact currency prices?
Part 6 - Core strategies for trend trading
Jumping into the DailyFX Forex Trading Course Walkthrough: Part Six, you're probably here because you’ve seen the charts, tried the trades, and still feel like something’s missing. Maybe your setups aren’t sticking, or the news drops and your positions go sideways. This chapter gets into the meat of technical analysis and how to actually use DailyFX tools to trade smarter—not harder.
“Markets are never wrong—opinions often are,” said Jesse Livermore. We’ll cut through the fluff and help you read quotes like a pro, spot hot currency pairs, and understand what really moves prices.
By the end of this read, you’ll have a tight grip on trends, leverage, and the tools traders use every day. Think of it as sharpening your blade before stepping back into the arena. Let’s crack it open.
What is technical analysis in Forex
Technical analysis is the trader’s compass—helping you read the market’s next move before it happens.
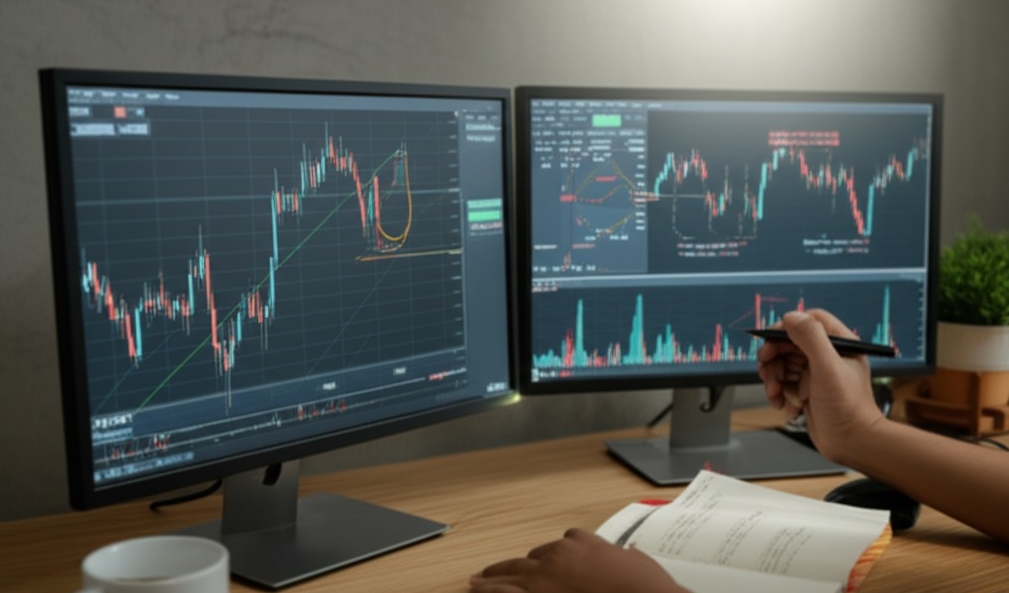
Reading candlestick patterns and chart shapes
Candlestick patterns are like market mood swings captured in color. A bullish hammer after a downtrend? That's a hint buyers are waking up. A bearish engulfing pattern at a peak? Time to think twice about holding long. Shapes like Head and Shoulders or Double Top scream potential reversals. Don’t ignore a Doji—it’s the market’s version of “I’m not sure yet.” Mastering this stuff means reading trader psychology in real time.
Using moving averages to find trends
SMA vs EMA: SMA gives you the slow, steady view. EMA? Faster reactions to price.
Crossovers: When the short-term MA crosses the long-term, it’s go-time for many traders.
Trend strength: The wider the gap between MAs, the stronger the trend.
These indicators may lag, but they’re gold for spotting overall trend direction.
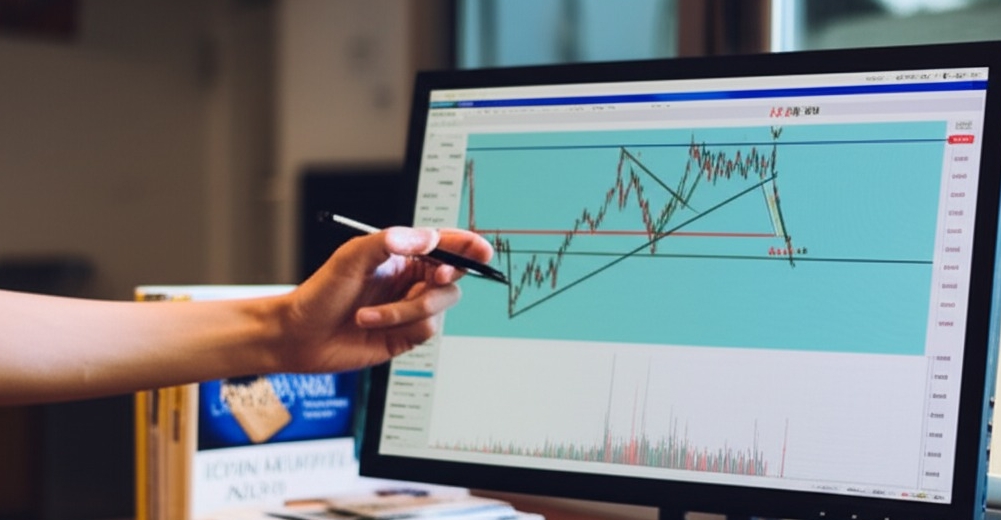
Identifying support and resistance zones
Support zones are price floors where buyers usually step in.
Resistance zones are ceilings where selling pressure builds.
Use horizontal levels and trendlines to map these out.
Price bouncing off support? Might be a buy. Breaking resistance? Watch for a retest before jumping in.
Pro tip: Combine these with volume for stronger entries.
Why volume matters in technical setups
“Volume is the fuel behind every price move.” – John Murphy, technical analysis author
Big breakout with tiny volume? Meh. But a strong move with surging trading volume? That’s confirmation. Volume shows if the market’s really behind the move or just faking it. Look at accumulation during quiet phases and distribution at highs. It’s like seeing who’s quietly buying or cashing out. Without volume analysis, technical setups are half the picture.
How do you read a Forex quote
If Forex quotes look like a confusing soup of numbers, don’t sweat it—this cluster will break it down, real smooth.
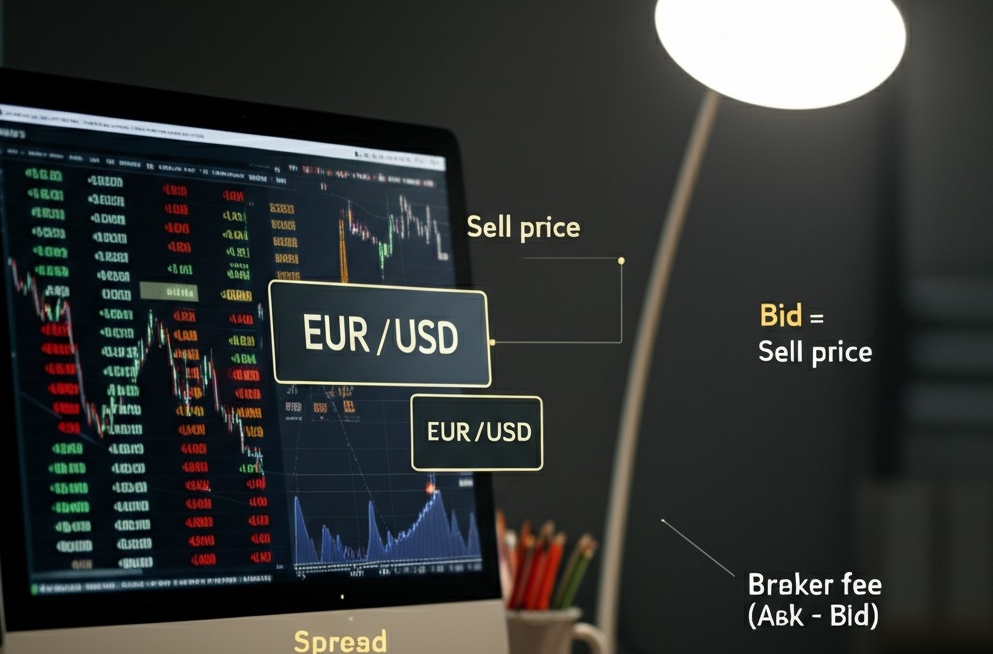
Understanding bid, ask, and spread
Forex quotes come with two prices: the bid price (what buyers are willing to pay) and the ask price (what sellers want). The spread is the tiny difference between them—and that’s where brokers make their money.
Bid = Sell price (what you sell at)
Ask = Buy price (what you buy at)
Spread = Ask – Bid (broker fee)
Think of it like buying sneakers from a reseller: they buy low (bid), sell high (ask), and the spread is their profit. Add liquidity and market makers, and you’ve got a dynamic little ecosystem right inside the order book.
What are pips and how to measure them
In Forex, a pip stands for “point in percentage.” It’s the fourth decimal place in most currency pairs (e.g., 0.0001). For JPY pairs, it's the second decimal.
Let’s say EUR/USD moves from 1.1020 to 1.1025 — that’s a 5 pip move. Measuring pips helps traders calculate profit, loss, and risk per trade.
| Currency Pair | Move | Pip Value (Standard Lot) |
|---|---|---|
| EUR/USD | 0.0001 | $10 |
| USD/JPY | 0.01 | $9.13 |
| GBP/USD | 0.0001 | $10 |

Base and quote currency explained
Alright, let’s get our pairs straight: In a currency pair like EUR/USD, the base currency is the first one (EUR), and the quote currency is the second (USD). So EUR/USD = 1.10 means 1 euro = 1.10 US dollars.
The base currency is what you're buying or selling.
The quote currency is what you're paying or receiving.
Major pairs (like USD/JPY) are the most traded and offer better liquidity.
As trading legend Kathy Lien says, “Understanding the quote is your first step in mastering the market.”
Which currency pairs are best for beginners
"New traders often ask me, ‘Which currency pairs should I start with?’" says Mark Ellison, a senior analyst with over 15 years of forex trading experience and a former guest on CNBC's Fast Money. His answer is always the same: Start simple, start stable.
For beginners stepping into forex trading, major pairs offer the best mix of liquidity, low spreads, and consistent behavior. These are pairs like EUR/USD, GBP/USD, and USD/JPY. They are favored by top-tier institutions and retail traders alike for good reason:
EUR/USD: Known for tight spreads and high trading volume. It reacts clearly to U.S. and Eurozone news events.
USD/JPY: Offers smooth price action and lower volatility spikes. A good learning ground for chart-reading.
GBP/USD: Slightly more volatile, yet offers strong trending behavior. Great for traders learning breakout setups.
According to data from the Bank for International Settlements, these major pairs account for over 70% of daily forex volume. High liquidity reduces slippage, making entries and exits cleaner—especially for those still mastering order types.
"Jumping into exotic pairs too soon is like learning to drive on a racetrack," says Ellison. "Stick to the majors until your risk management skills catch up."
Forex educators such as BabyPips and institutions like IG and DailyFX regularly emphasize the same trio of pairs in beginner courses. Stability, accessibility, and tight spreads make them ideal for building skills without getting burned.
DailyFX tools for smarter trading
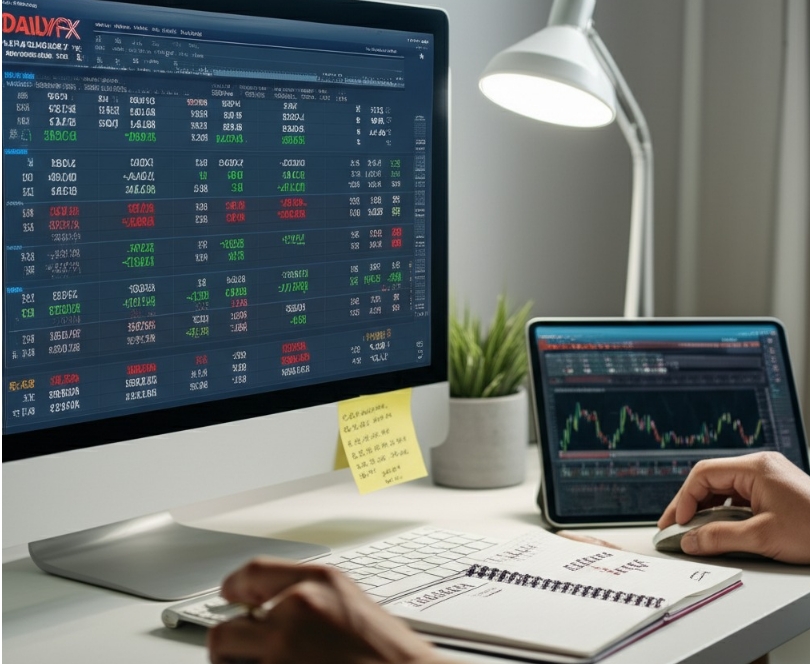
Want to stop trading blind? Let’s plug into tools that help you read the market like a seasoned pro—straight from the DailyFX playbook.
Using the DailyFX sentiment indicators
Ever feel like you're the last one to jump on a trend? That’s where DailyFX sentiment indicators come in. These tools reveal what most traders are doing—so you can do the opposite, if needed.
Speculative Sentiment Index (SSI): See the % of traders long vs. short on popular currency pairs.
Contrarian strategies: When most traders are long, it could be time to short—market sentiment often works like that.
Application example: Pair sentiment with price action for smarter entries and exits.
“Market sentiment is often the final puzzle piece before pulling the trigger on a trade.” – Kathy Lien, Managing Director, BK Asset Management
Setting up an economic calendar
A well-set economic calendar is like having radar for incoming market turbulence.
Pick your time zone: Sync the calendar to your trading hours to avoid surprise volatility.
Filter by currency and impact: Focus on relevant indicators like NFP, CPI, or rate decisions that hit your chosen markets.
Set alerts for news releases: Let the calendar notify you—so you’re not refreshing like a maniac before a big report.
| Indicator Name | Typical Impact | Update Frequency |
|---|---|---|
| NFP (Non-Farm Payrolls) | High | Monthly |
| Fed Rate Decision | Very High | Scheduled |
| CPI (Inflation Data) | Medium–High | Monthly |
These market events often spark serious moves—don’t let them catch you napping.

How does news impact currency prices
News moves markets—fast. If you're not prepared, your trades could take a hit before you even blink.
Why central bank announcements move markets
Central banks don’t just set interest rates—they set the tone for the entire market. When the FOMC, ECB, or another bank drops new forward guidance or comments on inflation, traders listen closely. A single press conference can spark major market reaction, especially if it hints at changes in monetary policy or the employment report surprises. These events inject serious volatility, and if you’re not ready, you’ll miss the wave—or get slammed by it.
Trading during high-impact news events
Check the economic calendar daily for high-impact news like Non-Farm Payrolls, CPI, and GDP reports.
Use a clear trading strategy that includes risk management and strict stop-loss levels.
Expect sharp market volatility and avoid guessing—trade reaction, not prediction.
Some seasoned traders even skip news events entirely to avoid unnecessary slippage.
Pro Tip: “News trading is all about reaction, not prediction.” — Kathy Lien, Managing Director of FX Strategy at BK Asset Management
Avoiding slippage in fast-moving markets
When markets move like a bat outta hell, your order might not land where you hoped. That’s slippage—and it stings. Use a limit order to lock in your entry price, instead of a market order that can chase price during a fast market. Also, consider trading on platforms with tighter bid-ask spreads and faster execution speed to dodge requotes.
| Order Type | Control Over Price | Slippage Risk |
|---|---|---|
| Market Order | Low | High |
| Limit Order | High | Low |
| Stop Order | Medium | Medium |
Core strategies for trend trading
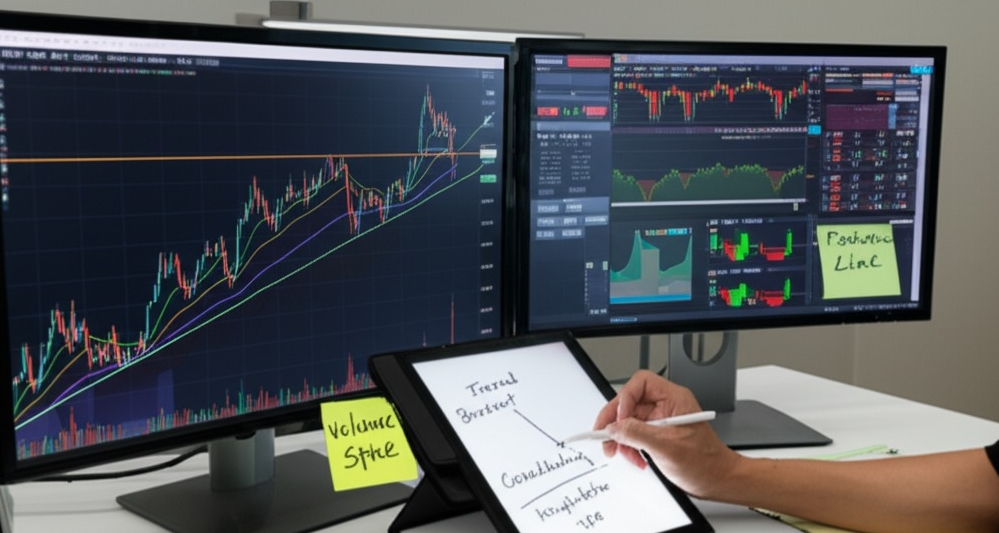
Get a grip on real-world methods to ride the wave of Forex momentum like the pros do—no fluff, just tactics that work.
Identifying early trend formations
Spotting trends early can be the difference between riding the wave or getting wiped out.
Trend lines: Connect higher lows or lower highs for structure.
Moving averages: When short-term averages cross long-term ones, momentum’s shifting.
Volume analysis: Rising volume with price breakout = strong trend forming.
Divergence: When price rises but momentum slows, a reversal might be brewing.
Combine these with consolidation zones and breakout signals for better timing.
Trading with Fibonacci retracements
Let’s get nerdy—but in a good way. Fibonacci levels help you catch pullbacks without guessing.
Identify a swing high and swing low.
Plot retracement levels (38.2%, 50%, 61.8%)—these are likely bounce zones.
Use price action at these levels for entry points.
Set exit points using extension levels and manage risk with tight stops.
“Fibs” work best when aligned with strong support and resistance zones.
Managing trades with trailing stops
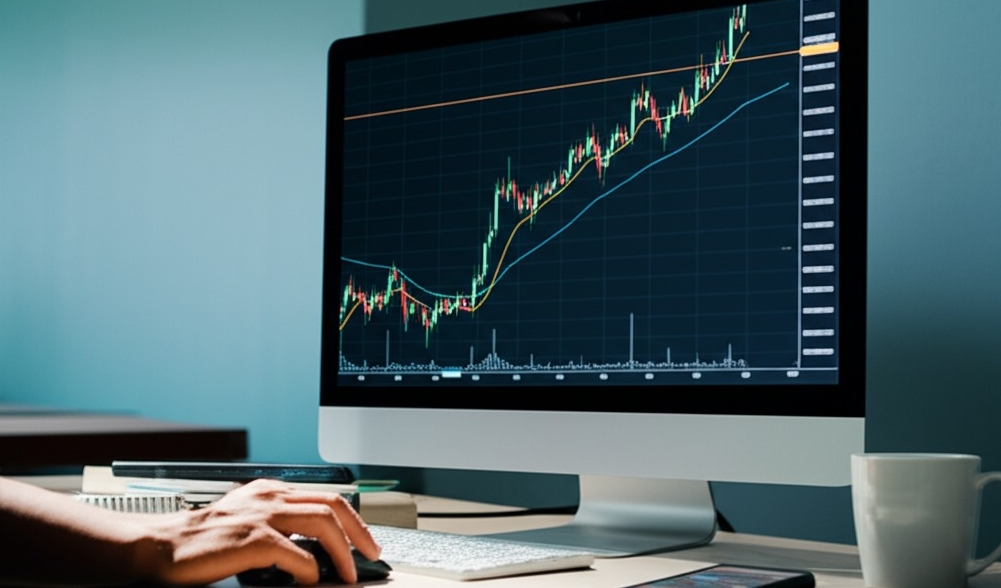
You know that feeling when you were up in a trade… and then poof? Trailing stops help lock in gains while giving trades room to breathe.
A trailing stop loss moves with price to protect profit.
Adjust based on volatility or fixed pip distance.
Ideal during strong moves but can get chopped in sideways markets.
Combine with position sizing for smarter risk management.
This is your invisible safety net—don’t leave home without it.
Entering after a breakout confirmation
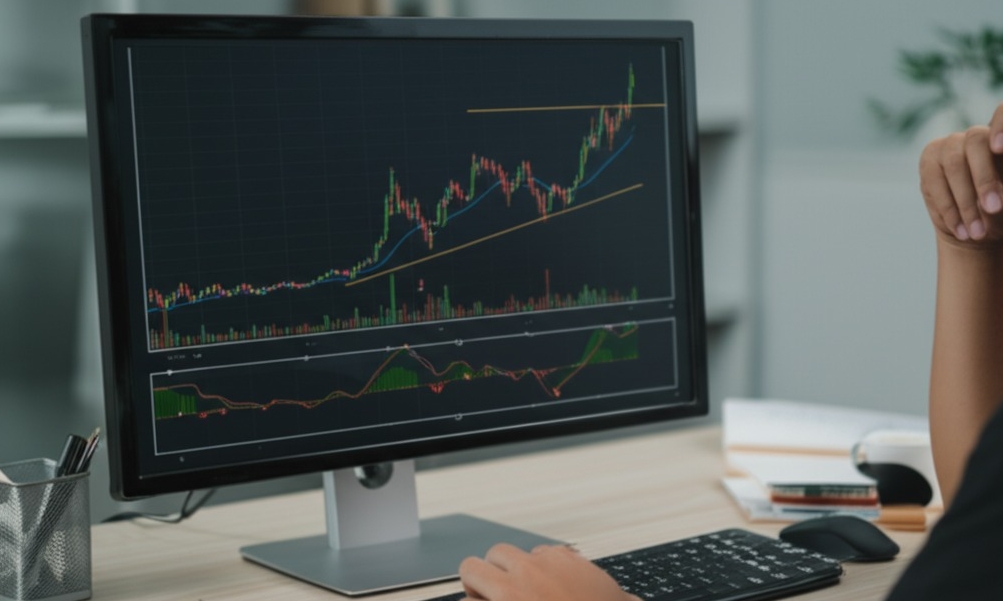
Don’t jump the gun—wait for proof. Breakouts can fake you out.
Spot a resistance break or support break on the chart
Watch for volume spike and retest of the breakout zone
Confirm with momentum indicators or price action
Only then—enter at a clean entry point
This method keeps you out of messy false breakouts. Discipline wins.
Why trend trading suits Forex volatility
Forex markets are like a caffeinated cheetah—fast, erratic, but with big moves. That’s where trend trading shines.
High volatility = bigger price swings to capitalize on
Constant liquidity in major currency pairs
Leverage amplifies gains (and losses)—plan accordingly
Trends in Forex often last longer due to macroeconomic momentum
As one trader said, “Volatility is the heartbeat of the market—ride it, don’t fight it.”
John Bollinger, creator of Bollinger Bands, once noted:
“Markets trend only about 30% of the time, but that’s when 90% of the money is made.”
What is the risk of using leverage
Leverage can feel like nitro fuel for your trades—but push it too far, and you're just as likely to blow the engine. Let’s break down the real risks.
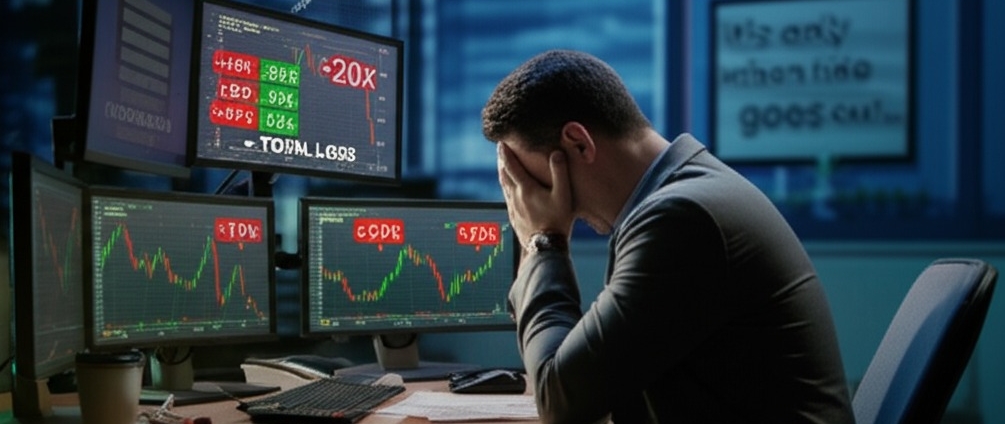
How leverage magnifies both gains and losses
Leverage is like a double-edged sword—it can multiply your wins, but it can also slam your losses. Here’s what traders often overlook:
Magnification effect: A 10% move in your favor at 10x leverage becomes a 100% gain—but the opposite can wipe out your entire capital.
Risk exposure grows with less margin in the account.
More leverage = more emotion, especially under volatility.
Using debt in investment trading means your account doesn’t just reflect what you own—but what you owe.
As Warren Buffett puts it: “It’s only when the tide goes out that you discover who’s been swimming naked.” High leverage can leave you pretty exposed.
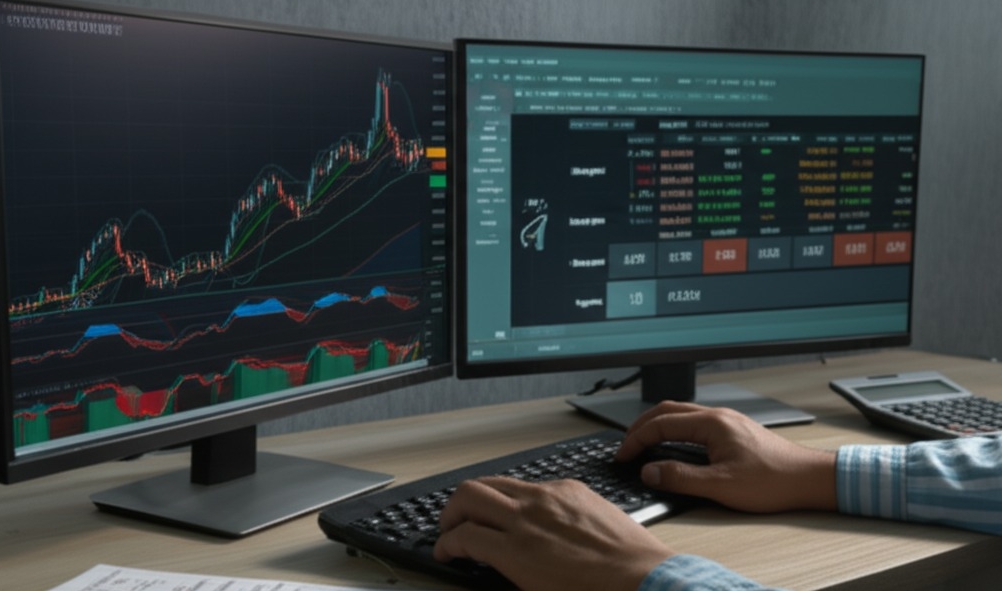
Setting realistic stop-loss levels
Analyze volatility: Use ATR or Bollinger Bands to gauge price swings and adjust your stop accordingly.
Position sizing matters: Don’t risk more than 1–2% of your account on any trade.
Respect support and resistance: Set stops just beyond key zones—not right on top of them.
Align with strategy: A scalper’s stop-loss is not the same as a swing trader’s.
Risk tolerance is personal: If losing that amount ruins your day, your stop is too loose.
Stop-loss isn’t about avoiding loss—it’s about making sure the loss doesn’t tank your whole strategy.
DailyFX+ vs FXStreet
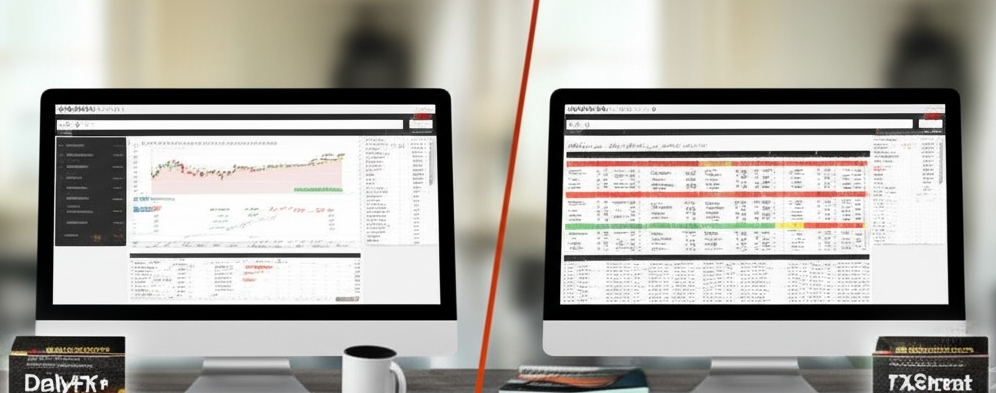
“Between DailyFX+ and FXStreet, which platform really delivers for retail traders?” I asked Thomas Leclerc, a senior market analyst with fifteen years of Forex experience under his belt and a loyal user of both services. His reply was candid: “If you want clean technical analysis with sentiment data baked in, DailyFX+ wins. For fast, headline-driven news updates, FXStreet takes the lead.”
Traders often toggle between both. DailyFX+ caters to FXCM clients, offering direct platform integration with real-time sentiment tools, actionable trading signals, and chart setups that beginners can follow. Its educational section, backed by IG Group, is structured like a guided course—awarded by ADVFN for educational excellence. FXStreet, on the other hand, excels in breaking macroeconomic news, economic calendars, and multilingual coverage, making it popular among non-native English speakers.
From the lens of usability and trust:
DailyFX+ offers curated tools, trading alerts, and analysis tailored for execution.
FXStreet thrives on speed, cross-border coverage, and a global newsroom.
Both platforms have earned mentions in Investopedia, Bloomberg, and Reuters, reinforcing their credibility in financial media. Traders looking for simplicity lean toward DailyFX+; those seeking breadth lean toward FXStreet. “Honestly,” Thomas added, “it depends on how fast you trade and how much hand-holding you need.”
Conclusion
You’ve just walked through some of the real nuts and bolts of Forex—quotes, trends, tools, and the stuff that actually moves the market. It’s a lot, but now you’ve got a solid grip on the wheel.
“Trade what you see, not what you think.” — is something old-school pros swear by, and it sticks because the market doesn’t wait for guesses.
So now it’s time to roll up your sleeves. Fire up those charts, test your setups, and let the market be your best teacher.
A pip stands for “percentage in point” and it’s the smallest price movement in most currency pairs—usually the fourth decimal place. For example, if EUR/USD moves from 1.1050 to 1.1051, that's a 1 pip move. It’s tiny, but when you’re trading big volumes, even a few pips can mean real money.
Leverage lets you control a larger trade size than your account balance would normally allow. It amplifies gains—but also losses—so use it wisely. Think of it like borrowing money to make a bet: if you're right, you win big; if you're wrong, you owe more than you expected.
It’s a tool that shows upcoming news events (like interest rate decisions or job reports) that can affect currency prices. Traders use it to:
Plan entries and exits around volatility
Avoid risky periods when spreads widen
Anticipate market reactions to big announcements
Compare past forecasts vs. actual outcomes
No single indicator is perfect, but some commonly used ones include:
These help confirm trends, spot reversals, and avoid jumping in too early.
Moving Averages (simple & exponential)
RSI (Relative Strength Index)
MACD (Moving Average Convergence Divergence)
Bollinger Bands
DailyFX is more tightly integrated with IG’s trading ecosystem, while FXStreet stands alone as an analytics platform. Both offer news, charts, and tools—but DailyFX leans more toward guided trader education, while FXStreet feels more like a pure news desk.
Not even close. Some pairs are known for wild swings (like GBP/JPY), while others are more stable. For new traders, the “majors” like EUR/USD or USD/JPY are a safer starting point—they’ve got high liquidity and lower spreads.
This one’s tough because it’s more about psychology than strategy. A few habits that help:
Overtrading kills more accounts than bad strategies do.
Set a daily or weekly trade limit
Journal each trade to stay accountable
Take breaks after a loss or win streak
Only trade when your setup is clear—not out of boredom


