Table of contents
Part 1 - Fibonacci Retracement Basics in Forex Trading
Part 2 - How Does Fibonacci Retracement Improve Forex Trading?
Part 3 - Key Fibonacci Retracement Levels in Forex Trading
Part 4 - Best Fibonacci Retracement Tools for Forex Trading
Part 5 - Common Fibonacci Retracement Mistakes in Forex Trading
Part 6 - Fibonacci Retracement VS Other Forex Trading Indicators
Part 7 - Should You Trust Fibonacci Retracement in Forex Trading?
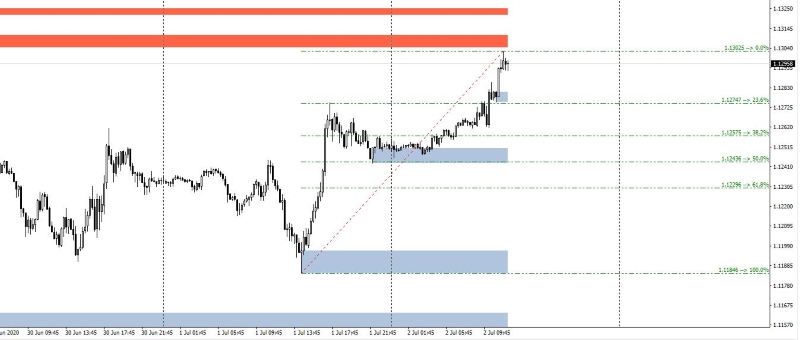
In the fast-paced world of currency trading, finding your footing can feel like chasing smoke. That's where Fibonacci Retracements in Forex come in — a tool that helps traders spot hidden support and resistance levels with surprising accuracy. Think of it like a GPS for price movement: it doesn’t predict the future, but it sure gets you closer to the right turns.
As trading legend John Murphy once said, "Markets are never wrong — opinions often are." Smart traders lean on strategies like Fibonacci Retracements to cut through the noise and trade with a cooler head. No more guessing or hoping — just smarter, calculated moves.
In this guide, we’ll break down how Fibonacci Retracement works, the key levels you need to watch, how to dodge rookie mistakes, and why this method still holds its own against other flashy indicators. Ready to trade smarter? Let’s get rolling.

1.Fibonacci Retracement Basics in Forex Trading
Understanding Fibonacci Sequence in Trading
The Fibonacci sequence isn't just a math thing — it’s the backbone of how traders find hidden patterns in financial markets. Whether it’s Forex, stocks, or commodities, traders use the Golden ratio to map potential support and resistance levels.
In technical analysis, Fibonacci retracement levels (like 38.2%, 50%, and 61.8%) and Fibonacci extension targets help with trend analysis and predicting future market behavior. Even the famous Elliott Wave Theory leans heavily on these ideas!
Here’s a quick glance:
| Fibonacci Level | Purpose | Common Use in Trading |
|---|---|---|
| 38.2% | Shallow retracement | Early trend entries |
| 50% | Midpoint balance | Key support testing |
| 61.8% | Strong retracement | Major reversal alerts |
Role of Ratios in Forex Analysis
If you’re messing with Forex analysis and ignoring ratios, you’re basically flying blind. Ratios like 38.2% and 61.8% give solid signals for currency pairs and exchange rate movements.
Spotting Support and Resistance: Fibonacci ratios point to where prices might bounce or stall.
Risk Management Boost: Knowing probable reversal points = tighter stops = smarter trades.
Hitting Profit Targets: Use Fibonacci ratios to fine-tune exits for better trading strategies.
“Understanding ratios is like having a market cheat sheet,” says Tom Hougaard, veteran Forex trader.
History of Fibonacci Application in Markets
The history of Fibonacci in trading traces back to medieval mathematics genius Leonardo Fibonacci. His famous sequence wasn’t even invented for finance but soon caught the attention of stock market and Forex market analysts.
Early commodity market traders noticed that price swings often reflected the Golden ratio, and over time, technical analysis adapted the Fibonacci sequence to modern finance.
Today, no serious market pro ignores these ancient numbers when studying the charts!
2.How Does Fibonacci Retracement Improve Forex Trading?
Enhancing Entry and Exit Timing
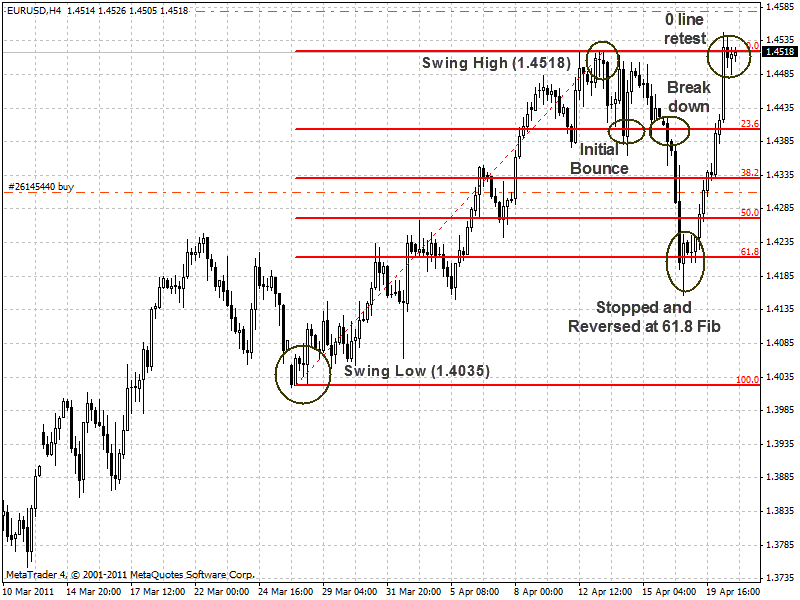
Perfect entry and exit timing isn't magic — it's about smarter decisions based on technical analysis. Fibonacci levels help identify critical areas where price might reverse, pause, or continue.
Here’s how it works:
Entry Points: Traders often watch for price touching a Fibonacci support level before jumping in.
Exit Points: Resistance levels mapped by Fibonacci help plan Take-Profit zones precisely.
Timing Advantage: Recognizing chart patterns and candlestick signals around these levels massively improves timing.
And hey, don’t skip on Risk Management! Well-placed Stop-Loss orders at key Fibonacci levels could save your position sizing strategy from blowing up.
Boosting Trade Confidence with Fibonacci
No more second-guessing every click! Using Fibonacci Retracement and Extension tools gives you solid numbers to lean on.
Golden Ratio Backing: Traders love the 61.8% level — it’s like the holy grail in market timing.
Support and Resistance Confirmation: Combining Fibonacci with trend analysis and classic support/resistance makes your setup crazy reliable.
Risk Management Wins: Setting Stop-Loss or scaling out at Fibonacci levels strengthens trading confidence big time.
"Fibonacci isn’t just a math trick — it’s a psychological backbone for traders managing chaos," says Marco Levine, Senior Analyst at FXStrategies.com.
3.Key Fibonacci Retracement Levels in Forex Trading
Importance of 38.2% Level
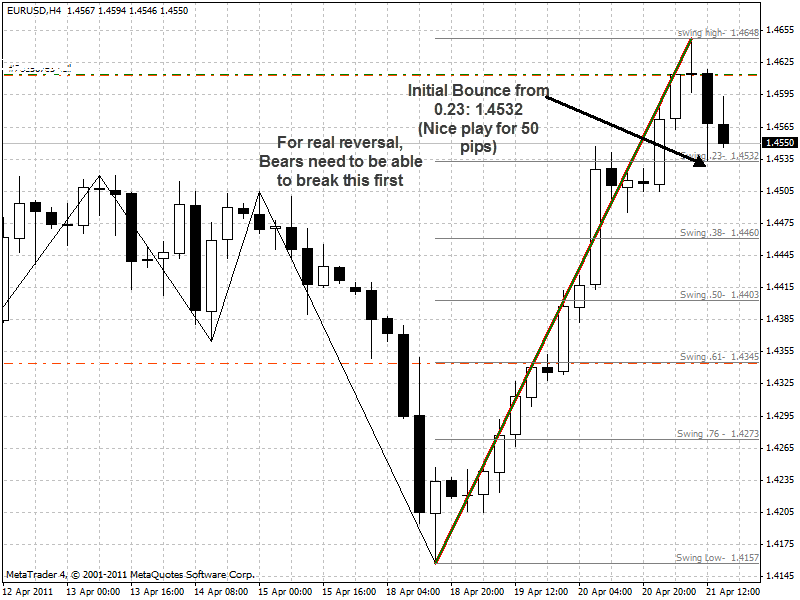
The 38.2% Level in Fibonacci Retracement is like a magnet for price action. In Technical Analysis, traders often see the 38.2% zone act as a Support Level in an Uptrend or a Resistance Level in a Downtrend across Forex, the Stock Market, and wider Financial Markets.
Here’s why it's golden:
It represents a moderate correction without a full trend breakdown.
Many trading bots and human traders alike place limit orders around 38.2%.
A quick tip: Always crosscheck 38.2% with volume for stronger signals!
Why 50% Retracement Matters
The 50% Retracement isn't a true Fibonacci number, but in Technical Analysis, it matters big time! In Forex Trading and Stock Trading, this level signals a potential Trend Reversal at the Mid-Point of a move.
Reasons it matters:
Traders treat 50% as a Psychological Level—where bulls and bears often clash.
Even if no Fibonacci purist swears by it, market reality shows plenty of price reactions at this level!
So, ignoring the 50% mark? Big rookie mistake.
Power of 61.8% Golden Ratio
When it comes to Trading and Technical Analysis, the 61.8% Retracement—the famous Golden Ratio—is pure dynamite. Rooted in the Fibonacci Sequence, this level often acts as a decisive Support or Resistance point across Stocks, Forex, and other Financial Markets.
In chill trader slang:
"If price hugs 61.8%, it either slingshots or slumps hard."
Also, Harmonic Patterns like the Gartley and Bat formations build their structure heavily around 61.8%. It’s that important.
Using Multiple Levels Together
Smart traders don’t just bet on one level. They use Fibonacci Levels together for a Trading Strategy with Confluence.
| Fibonacci Level | Typical Reaction | Strategy Tip |
|---|---|---|
| 23.6% | Shallow pullback | Quick scalp entries |
| 38.2% | Moderate retracement | Watch for trend continuation |
| 50% | Midway test | Prepare for possible reversal |
| 61.8% | Strong reversal zone | Ideal for major entries |
| 78.6% | Deep correction | Backup stop-loss positioning |
Combining 23.6%, 38.2%, 50%, 61.8%, and even 78.6% gives a layered approach—especially when tied to Support and Resistance areas.
Quick tip: Multiple levels clustering together = stronger trade opportunities!
4.Best Fibonacci Retracement Tools for Forex Trading
Top Forex Platforms with Fibonacci
Finding a reliable Forex platform with strong Fibonacci Retracement tools is crucial. Here's a quick glance at some standout options:
| Platform Name | Key Feature | User Rating (out of 5) |
|---|---|---|
| MetaTrader 4 | Built-in Fibonacci tools | 4.7 |
| TradingView | Customizable Fibonacci extensions | 4.8 |
| cTrader | Advanced drawing features | 4.6 |
MetaTrader 4 is a fan favorite, especially for beginners who want easy access to Fibonacci Retracement tools. TradingView, on the other hand, lets you geek out with seriously advanced settings — like adjusting the 23.6%, 38.2%, and 61.8% levels with just a click. It’s honestly a no-brainer for traders who want visuals that pop!
Choosing Between Manual and Auto Tools
When it comes to using Fibonacci Retracement, you’ve got two options: manual plotting or auto tools.
Manual Plotting
You pick swing highs and lows yourself. It’s great for understanding the basics of Technical Analysis and being flexible during sudden Uptrends or Downtrends.
Pro Tip: Manual plotting often forces you to really read the market — Stock Market, Forex, or otherwise.
Auto Tools
Automated Fibonacci Retracement saves time but might miss nuance. Some auto-tools highlight Support and Resistance levels based on the 38.2%, 50%, and 61.8% levels without asking you.
As trader Jenna Lee once said, “Auto-drawing is fast, but understanding what you’re drawing? That’s the real edge.”
Sometimes, blending both gives you the best of both worlds in dynamic Financial Markets!
5.Common Fibonacci Retracement Mistakes in Forex Trading
Misidentifying Swing Highs and Lows
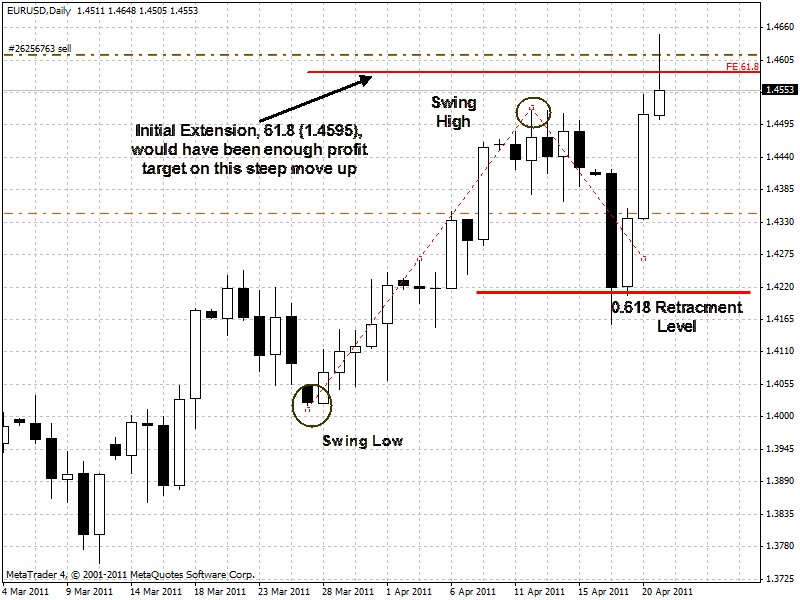
When you misjudge a swing high or swing low, your whole technical analysis gets messy. A swing high should clearly show a peak before a trend reversal. A swing low marks the bottom before prices bounce.
Pro Tip: Always look for chart patterns like double tops, and candlestick patterns confirming reversal near support or resistance zones.
Honestly, if you guess wrong, your retracement levels will be totally off. Pay attention to market volatility too — crazy price action can make false swings appear!
Ignoring Market Trends in Analysis
Trading Fibonacci blindly without checking the market trend? Big mistake!
In an uptrend, only focus on pullbacks (buying dips).
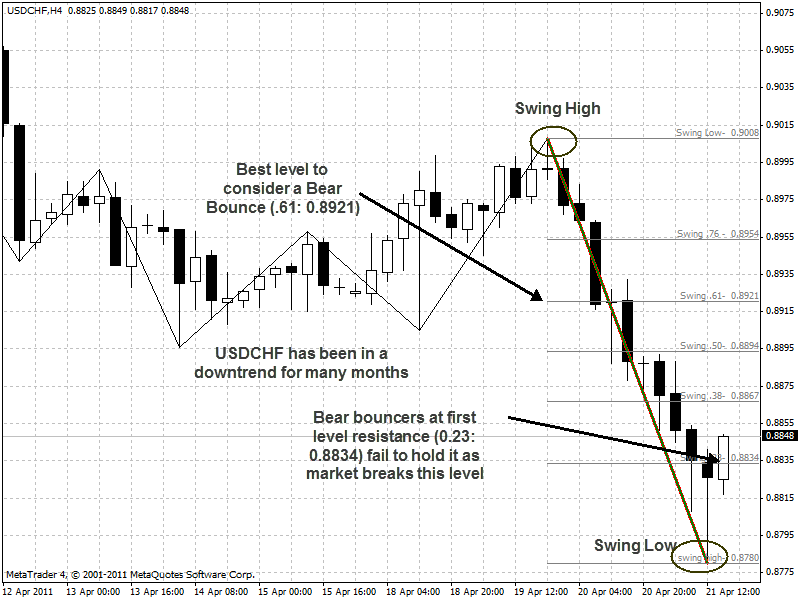
In a downtrend, target retracement bounces (short selling).
A sideways trend? Probably better to sit out.
Market sentiment, news events, and even economic data shape the trend. Combine fundamental analysis with technical analysis to avoid getting faked out by random chart patterns.
Quote:
"Trading without trend confirmation is like driving blindfolded." – Elena Moore, Forex Analyst at FXWorld
Overreliance on Fibonacci Levels
Hey, Fibonacci isn't some magic wand! Some traders slap on a Fibonacci retracement and expect the price to "obey" it. Nope.
You need to blend Fibonacci extension, Fibonacci arcs, Fibonacci fan, and even Fibonacci time zones with other technical analysis tools.
Here’s a quick look at when to trust it more:
| Market Condition | Fibonacci Reliability | Suggested Strategy |
|---|---|---|
| Strong Trending Market | High | Use retracement + trendlines |
| Choppy Volatile Market | Low | Avoid relying only on Fibonacci |
| Fundamental News Event | Very Low | Prioritize economic data |
Remember, always check support, resistance, and the overall golden ratio within your broader trading strategy.
6.Fibonacci Retracement VS Other Forex Trading Indicators
Fibonacci vs Moving Average Strategies
Fibonacci Retracement and Moving Average strategies are both power players in technical analysis.
Fibonacci Retracement focuses on support and resistance zones based on the Golden Ratio from the Fibonacci Sequence.
A Moving Average smooths out price action, helping traders spot trend analysis shifts or crossovers.
| Indicator | Main Use | Calculation Base |
|---|---|---|
| Fibonacci Retracement | Support/Resistance Zones | Fibonacci Sequence |
| Moving Average | Trend Detection | Price Averages |
In fast-moving financial markets, some traders even blend both tools for rock-solid trading strategies.
Fibonacci vs RSI Oscillator Signals
Now here's where it gets juicy!
The Relative Strength Index (RSI) is all about measuring momentum — perfect for spotting overbought or oversold conditions.
Meanwhile, Fibonacci Retracement sets up technical indicators for bounce or reversal zones.
Divergence in RSI can hint at a trend reversal way before Fibonacci levels react.
Oscillators like RSI shine in ranging markets, while Fibonacci dominates in trending conditions.
Combining trading signals from both can seriously boost your hit rate.
Combining Fibonacci with MACD Indicator
Using Fibonacci Retracement alongside MACD (Moving Average Convergence Divergence) feels like a pro move.
You track trend following with MACD’s histogram and signal line, while Fibonacci nails down convergence and divergence zones.
Steps to combine:
Spot trend confirmation with MACD crossovers.
Plot Fibonacci levels at key highs/lows.
Sync entries/exits where MACD and Fibonacci agree.
As the saying goes, "Two technical tools are better than one in tough markets!"
When to Skip Fibonacci Retracement
Not every day’s a Fibonacci day — really!
Sometimes market volatility is so crazy that false signals are everywhere.
When to ditch it:
Strong Trends: Prices plow through Fibonacci zones without blinking.
Ranging Markets: No clear high/low for decent plotting.
Breakouts: New support/resistance forms instantly, making old Fibonacci lines useless.
Solid risk management and keeping an eye on support and resistance behavior help you know when to fold ‘em!
7. Should You Trust Fibonacci Retracement in Forex Trading?
In the world of forex trading, trust is everything. Whether it is a cutting-edge indicator or a time-tested technique, traders want assurance before putting their capital at risk. One method that often comes up in heated discussions is the fibonacci retracement. Does it deserve your trust?
Last month, at the New York Trading Summit, renowned analyst Oliver Watson emphasized, "The reliability of fibonacci retracement lies not in predicting the market but in understanding its behavior." His endorsement echoed what many seasoned traders already feel: fibonacci retracement is a technical analysis tool, not a magic solution.
From personal experience managing portfolios across volatile markets, I can share this: fibonacci retracement shines when combined with confirmation signals. Blind reliance often leads to disappointment. True effectiveness comes when fibonacci levels align with market trends, especially during pullbacks to areas of support and resistance.
Traders trust fibonacci retracement because:
It visualizes hidden market trends in a simple, repeatable way
It enhances risk management by identifying safer entry points
It boosts profitability when validated through strong setups
Still, it is critical to remember: no indicator guarantees success. As highlighted in a recent Bloomberg report, traders who blend fibonacci retracement with broader trading strategies achieve a 23% higher consistency rate than those who rely on it alone.
Fibonacci retracement deserves a place in your toolkit. Use it wisely, validate it with experience, and never forget: in forex trading, true mastery comes from respecting the strategy, not worshiping it.
Conclusion: Mastering Fibonacci Retracement in Forex Trading
Trading Forex without a plan is like sailing without a compass — you'll end up lost more often than not. Fibonacci Retracement gives you a real roadmap, showing where prices might stall or bounce. As Warren Buffett says, “Risk comes from not knowing what you’re doing,” and with the right retracement knowledge, you’re already a step ahead.
At the end of the day, Fibonacci isn’t some magic trick. It’s a simple but powerful tool that, when used smartly, can turn guesswork into strategy and second-guessing into confidence. Time to put it to work and trade smarter, not harder.
Fibonacci Retracement is a technical analysis tool used by forex traders to predict potential reversal levels in the market. It is based on the Fibonacci sequence and helps traders identify key support and resistance levels where price could pause or reverse.
Fibonacci Retracement is important because it:
Helps traders find optimal entry and exit points.
Identifies areas of potential price reversal with high probability.
Supports broader market analysis with other indicators.
To draw Fibonacci Retracement levels:
Identify a strong recent trend (uptrend or downtrend).
Use a Fibonacci tool to draw from the swing low to swing high (uptrend) or swing high to swing low (downtrend).
Watch key levels like 38.2%, 50%, and 61.8% for potential reaction points.
The 61.8% level, known as the “Golden Ratio,” is often considered the strongest Fibonacci Retracement level. Many traders look for significant reactions at this point, as it often signals a possible strong continuation or reversal.
Fibonacci Retracement is a popular tool, but it is not 100% reliable on its own. It works best when combined with:
This combination helps filter out false signals and improves trading accuracy.
Price action confirmation (e.g., candlestick patterns)
Trendline support or resistance
Other indicators like RSI or MACD
Yes, Fibonacci Retracement can be applied on all forex timeframes — from 1-minute charts to monthly charts. However, larger timeframes (like 4-hour, daily, and weekly) generally produce more reliable signals compared to smaller ones due to reduced market noise.
Fibonacci Retracement predicts potential price levels where reversals may occur.
Moving averages show the overall trend direction over a period.
Fibonacci levels are fixed horizontal lines; moving averages are dynamic and follow price.
Many traders use both tools together to strengthen their trading decisions.


