Table of contents
Part 1 - Impact of US Elections on Gold
Part 2 - Gold Performance in Past Elections
Part 3 - Economic Policy and Gold Prices
Part 4 - Democrats vs Republicans: Gold Price Effects
Part 5 - How Does Election Uncertainty Affect Gold?
Part 6 - Why Do Investors Turn to Gold During Elections?
Part 7 - What to Expect for Gold in the 2024 Elections?
Part 8 - How Can Investors Prepare for Election-Driven Gold Shifts?
Gold Price Implications Around US Presidential Elections can feel like a rollercoaster ride for investors. Every four years, the US presidential race doesn’t just stir up political drama—it stirs up the gold market too. Gold, a go-to safe-haven asset, often reacts to the uncertainty and market jitters that come with elections, making it a must-watch for anyone with skin in the game.
Election years bring a lot of unknowns. Will a new president shake up policies? Will the economy take a turn? These questions can send gold prices swinging. As market watchers wait for answers, gold tends to become a go-to for investors looking to ride out the chaos. It’s like running for cover when the storm clouds roll in.
Experts often say, "Gold thrives in uncertainty." And when it comes to US elections, that’s exactly what you get—uncertainty, mixed with plenty of speculation. Let’s dive into how the political race shapes gold prices, and what it all means for your investments.
Impact of US Elections on Gold
US presidential elections have a significant impact on global markets, especially gold prices. Let's break down how elections create volatility in the gold market.
Political Shifts and Gold Price Volatility
Elections are full of uncertainty, and that’s exactly why gold prices tend to fluctuate. Political stability—or lack thereof—plays a major role in driving market sentiment. Geopolitical events, like shifts in government policy or international conflicts, can increase economic uncertainty, which in turn pushes investors towards gold as a safe-haven asset. Currency fluctuations, interest rate hikes, and inflation all add to the mix, further amplifying market volatility.
How Election Years Affect Investor Sentiment
Investor sentiment during election years is often a rollercoaster. With so much uncertainty surrounding policy changes and potential regulatory shifts, confidence can dip. The election cycle itself creates anxiety, as market players react to political rhetoric, voting patterns, and economic outlooks. Investors’ behavior shifts based on how they view the economic stability of a country under potential new leadership—fueling market reactions in the bond and stock markets.
Key Drivers of Gold Price Movements During Elections
Several factors come into play when determining gold's movement during elections. The outcome of the election itself can drastically change market dynamics—particularly in terms of fiscal policy, central bank decisions, and investor demand. Inflation expectations, geopolitical tensions, and shifts in global liquidity all drive the demand for gold as a safe-haven investment. Central banks’ monetary policies and economic indicators also play a crucial role in determining how investors view gold during election cycles.
| Factor | Impact on Gold Prices | Explanation |
|---|---|---|
| Election Outcome | High | A shift in leadership can create instability, pushing demand for gold. |
| Central Bank Policy | Moderate | Monetary policy influences interest rates, impacting gold's appeal. |
| Geopolitical Tensions | High | Global conflicts or instability increase gold's safe-haven demand. |
| Inflation Expectations | High | Higher inflation expectations tend to drive investors towards gold. |
| Market Liquidity | Moderate | Increased liquidity often leads to higher gold demand as a hedge. |
Gold Performance in Past Elections
Gold’s Response to the 2020 US Election
Gold saw significant volatility during the 2020 US presidential election, largely driven by political uncertainty. As Joe Biden took office, gold prices surged, fueled by fears of economic disruption and a potential recession. The Federal Reserve’s stimulus measures also played a crucial role. Gold became the "safe haven" asset as markets reacted to the election results. Investors turned to gold, knowing it traditionally thrives when the market is uncertain.
Trends from the 2008 Financial Crisis
The 2008 financial crisis is a prime example of gold’s role during economic instability. During this time, the collapse of Lehman Brothers and the housing bubble bursting left the economy reeling. Gold prices surged as the crisis deepened and the Federal Reserve slashed interest rates. Investors flocked to gold as a hedge against the plummeting dollar and soaring inflation. The market began recovering in 2009, but gold continued to perform well as the financial sector faced uncertainty.
A Historical Look at Gold in Election Cycles
Gold's response to presidential elections has been historically tied to political and economic shifts. From 1960 to 2020, each election cycle brought its own set of gold price movements. During times of political instability or recession fears, gold typically saw a price boost. Political events, like the Federal Reserve's interest rate changes and inflation concerns, significantly impacted gold's value. Historically, elections with uncertainty surrounding leadership often led to a rush toward gold as a safety net.
Comparing Different Presidential Elections
Every US presidential election cycle has its own unique impact on gold prices. In 2000, when the Bush vs. Gore election was contested, gold prices spiked due to uncertainty about the result. Similarly, in 2016, Donald Trump’s surprise victory saw immediate volatility, and gold saw a significant rise. Comparing these trends reveals how gold's behavior correlates to political changes, election results, and even voter turnout. Political party platforms, campaign finance, and the electoral college often influence investor behavior, causing fluctuations in the price of gold.
| Election Year | Gold Price Movement (USD/oz) | Key Event | Political Impact |
|---|---|---|---|
| 2000 (Bush vs. Gore) | +8% (from Nov 2000 - Jan 2001) | Election dispute and uncertainty | Election contested, markets reacted nervously |
| 2008 (Obama Victory) | +25% (2008 - 2009) | Financial crisis and market collapse | Flight to safe-haven assets as crisis deepened |
| 2016 (Trump Victory) | +4% (Post-election) | Surprise Trump win and market volatility | Uncertainty in policies and economic direction |
| 2020 (Biden Victory) | +20% (2020 - 2021) | Pandemic and stimulus measures | Economic uncertainty, stimulus-driven investment |
Economic Policy and Gold Prices
Economic policies—both monetary and fiscal—are major drivers of gold prices. Let's dive into how these policies shape the gold market.
Monetary Policy’s Influence on Gold Markets
Monetary policy decisions, especially those from central banks like the Federal Reserve or the European Central Bank, significantly impact gold prices. When interest rates are low, gold tends to shine since it offers a better store of value than interest-bearing assets. Inflation fears, resulting from excessive money printing or quantitative easing, can also push investors towards gold as a hedge. Additionally, changes in currency value—driven by central banks’ actions—make gold a safer investment in uncertain economic times. So, if the Fed raises rates or inflation spikes, gold might just become your best friend.
How Fiscal Decisions Affect Precious Metals
Fiscal policy can make or break precious metals like gold, silver, and platinum. Think about how government spending, taxation, or even budget deficits can influence economic stability. High national debt or reckless fiscal spending can erode confidence in the economy, leading investors to seek refuge in gold. For instance, as inflation rises due to increased government spending, the demand for gold increases as it outperforms other assets. Strong fiscal policy, however, may reduce the need for gold if economic growth is steady and inflation remains under control. The key here is the balance governments strike in their spending decisions.
Democrats vs Republicans: Gold Price Effects
Political parties shape more than just public policy—they affect the very way gold behaves in the market. Let’s explore how gold responds under Democratic and Republican presidencies.
Gold Prices Under Democratic Presidencies
Democratic administrations typically focus on spending to stimulate economic growth, which can lead to higher inflation and a weaker dollar. The Federal Reserve might increase interest rates, but gold often shines as an inflation hedge. Under such economic conditions, investors flock to gold for stability, pushing up its price.
Republican Policies and Gold Fluctuations
Republican policies often focus on tax cuts, deregulation, and economic growth. These policies can lead to a more volatile market. Gold can fluctuate under these conditions, as investors may shift toward equities and other assets, anticipating higher economic growth. However, during recessions or economic slowdowns, gold might see a spike due to its safe-haven status.
Election Promises: A Market Perspective
Elections bring promises that fuel uncertainty. Whether it’s tax reform, healthcare overhaul, or trade policies, campaign promises can shake up markets. Investors often react to these uncertainties, driving up gold prices, especially when promises involve major fiscal changes that could affect inflation or the economy’s stability. Gold becomes a safe bet in times of uncertainty.
How Political Ideologies Shape Economic Policy
Ideologies—whether capitalism, socialism, or conservatism—form the backbone of a nation’s economic policy. Democratic policies often support regulation and social welfare, while Republicans may lean toward less regulation and market-driven policies. Each approach impacts the broader economy, and gold reacts differently to these shifts, depending on the potential for inflation, regulation, or economic growth.
Gold's Role in Shifting Economic Landscapes
Gold has always been a cornerstone in times of economic turbulence. Whether it’s a recession, deflation, or inflation, gold provides investors with safety. In times when currency devaluation looms large or geopolitical risks rise, gold price shifts reflect its role as a hedge. With central banks and investors seeking gold to protect wealth, its value tends to increase during economic instability.
In the tug-of-war between Democrats and Republicans, gold often emerges as a consistent player, reacting to the broader economic policies each party brings to the table. From inflation and interest rates to tax cuts and deregulation, gold’s value fluctuates as it navigates through political ideologies, election promises, and shifting economic landscapes
How Does Election Uncertainty Affect Gold?
Election seasons are a hotbed for uncertainty, and that uncertainty often drives up gold prices. But how exactly does this volatility shape the gold market? Let’s break it down.

Investor Behavior in Times of Uncertainty
Investor behavior during uncertain times can be unpredictable. The fear of market volatility often leads to risk aversion, where investors look to minimize potential losses. Panic selling in the stock market might push many to gold as a safe haven. During elections, this surge in demand typically drives gold prices higher. Herd mentality also plays a role—when one investor buys gold in reaction to uncertainty, others follow suit, further driving the price up.
The Role of Uncertainty in Price Shifts
Uncertainty directly impacts price volatility in the gold market. As political risks loom large, economic indicators like inflation and interest rates fluctuate. Geopolitical risks can heighten tensions, leading investors to seek refuge in gold. Meanwhile, supply and demand dynamics shift as more people bet on gold’s safe-haven status, often causing price discovery to lean heavily towards upward momentum. This uncertainty can amplify fluctuations, making gold more attractive during the electoral process.
Why Do Investors Turn to Gold During Elections?
Gold often shines as a go-to investment during elections, with investors seeking stability amidst uncertainty. Let's explore why.
Gold as a Safe-Haven Asset
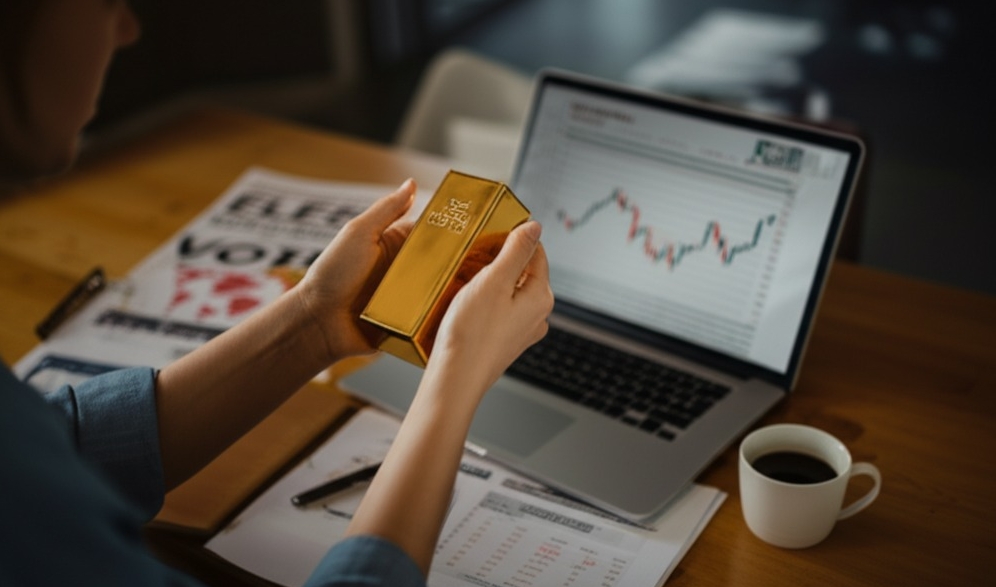
Gold is often seen as a "safe haven" asset, especially when market volatility spikes. Investors flock to it to preserve value during turbulent times. When elections stir up uncertainty, gold's role as a store of value becomes even more crucial. In the face of inflation, political upheaval, or financial crisis, gold maintains its appeal as a reliable asset for portfolio diversification and long-term stability.
| Factor | Impact on Gold | Reason |
|---|---|---|
| Economic Uncertainty | Increases demand for gold | Investors seek stability amid financial turbulence. |
| Political Instability | Gold price rises | Investors turn to safe-haven assets during periods of uncertainty. |
| Inflation or Recession | Gold price increases | Gold is a hedge against inflation and market downturns. |
Flight to Safety: Understanding Investor Fears
When elections loom, fear kicks in. Investors worry about economic recessions, geopolitical risks, and potential market downturns. This drives them to safer assets, like gold, as they seek capital preservation. Panic selling in other sectors often increases gold’s shine—an understandable reaction to economic uncertainty or a volatile political environment. A shift in sentiment makes gold the asset of choice during these times of fear and risk aversion.
How Gold Hedging Works During Election Cycles
Gold hedging is a popular strategy during election years. Investors use it to protect their portfolios from the effects of political instability. With futures contracts and options, they can hedge against market volatility. As election cycles create uncertainty, gold offers a hedge against fluctuating markets by providing a stable asset to balance potential losses from more volatile investments.
Historical Investor Behavior in Election Years
History shows that investors tend to lean toward gold during elections. Past election cycles have seen a flight to safety, especially during times of market stress. Stock market performance often fluctuates, and as political factors influence economic policies, gold becomes a favored choice. Historical data reveals that, during election years, market volatility increases, driving investors to seek security in assets that have consistently performed well, like gold.
What to Expect for Gold in the 2024 Elections?
As we look ahead to the 2024 elections, investors are naturally curious about how this event will impact gold prices. Let’s break down what to expect and the key factors to keep an eye on.
Predicting Market Movements for 2024
With market predictions pointing to potential volatility, financial analysts are keeping a close watch on economic indicators like inflation and interest rates. In 2024, the stock market may react strongly to election results, and gold is likely to be a safe haven. The 2024 outlook shows a mix of optimism and caution, making market analysis critical. As investment trends shift, understanding these movements will help prepare for gold price fluctuations.
Key Indicators to Watch in the Lead-Up to 2024
Inflation rate: An important indicator that affects gold’s attractiveness as a hedge.
Interest rates: Central banks' decisions here can influence gold prices, as higher rates often lead to lower demand for precious metals.
Consumer confidence: A shaky outlook could drive investors towards gold as a safer option.
Gold Price Expectations Post-Election
After the election results, gold prices could either surge or stabilize, depending on how the market interprets the political outcome. If economic uncertainty continues, gold may become even more appealing as an inflation hedge. Geopolitical factors and currency fluctuations will play significant roles in shaping gold price trends, so investors need to stay alert for changes in market sentiment post-election.
How Can Investors Prepare for Election-Driven Gold Shifts?
Navigating gold price shifts around elections requires smart strategies. In this chapter, we explore how diversification and careful timing can help investors stay ahead of the game.
Diversifying Investment Portfolios for Election Volatility
To handle market volatility during election periods, a well-diversified investment portfolio is key. Here's how you can position yourself:
Asset Allocation: Spread your investments across different asset types—stocks, bonds, gold, real estate—to reduce risks associated with market downturns and political instability.
Sector Diversification: Focus on sectors that tend to be less impacted by election cycles. For instance, consumer staples and healthcare may be less sensitive to election risks than cyclical industries like tech or energy.
Geographic Diversification: Don't put all your eggs in one basket. Invest in international assets to shield your portfolio from US political instability that may affect domestic markets.
Portfolio Rebalancing: Regularly reassess and rebalance your portfolio to align with shifting market conditions and your long-term financial goals.
Timing Gold Investments Around Election Periods
Gold has historically been a solid hedge against election-driven uncertainty, but timing your investment can make all the difference.
Monitor Market Trends: Gold prices often increase during times of heightened political risk or economic instability. Keep an eye on market movements as election season approaches.
Plan Investment Timing: If you're considering buying gold, aim to purchase when prices dip—this often happens before or right after an election when market volatility peaks.
Use Gold as a Safe Haven Asset: When economic uncertainty hits its peak during election periods, gold tends to shine. Increasing your gold allocation during these times can protect your portfolio from broader market losses.
| Election Year | Gold Price Movement | Key Market Events | Impact on Gold Prices |
|---|---|---|---|
| 2008 | +5% | Financial Crisis | Gold rose as a safe haven asset during economic turmoil. |
| 2016 | +8% | US Presidential Election | Gold surged due to uncertainty over the outcome of the election. |
| 2020 | +25% | COVID-19 Pandemic, Election Uncertainty | Gold hit new highs amid the pandemic and election turmoil. |
By integrating both diversification and market timing into your strategy, you’ll be more prepared for gold price shifts during election years.
Conclusion
US elections are a goldmine for volatility. Political uncertainty often pushes investors toward gold, making it a key player during election years. As the 2024 race heats up, understanding how elections shake up gold prices can give you a solid edge.
The gold market’s response to elections is no secret—it’s about managing risk while watching for opportunities. Keep your portfolio diversified, stay ahead of market signals, and you’ll be ready for what’s next.
"Gold shines brightest when the future’s cloudy." Be ready for the ride!
US presidential elections introduce a level of uncertainty into the markets, often leading investors to shift toward safer assets like gold. Gold tends to rise in value during election years because of the potential for political and economic volatility. When there’s uncertainty around policies or election outcomes, gold is seen as a stable investment that can weather the storm.
Key factors include:
- Political shifts that affect the economy.
- Policy changes that influence inflation rates.
- Uncertainty surrounding the outcome and potential economic disruption.
The 2020 US election was marked by extreme uncertainty due to the pandemic, economic conditions, and a highly contested race. Gold prices surged by over 25% leading up to the November election, reflecting investor fears and anticipation of a change in political leadership. The economic instability caused by COVID-19 also pushed investors toward gold as a safe-haven asset.
Gold has long been viewed as a safe-haven investment, especially during times of political instability. During US elections, investors often seek gold to protect their portfolios from market volatility. As elections bring unpredictability, gold’s intrinsic value and stability make it an attractive option to hedge against risk.
Reasons include:
- Gold’s resistance to inflation.
- Stability in uncertain economic environments.
- Limited correlation with stock markets.
- Protection against currency devaluation.
Investors often react to the uncertainty of presidential elections by moving away from riskier assets and toward more stable investments like gold. Political unpredictability, economic policy shifts, and potential changes in the regulatory landscape can cause market swings, prompting investors to seek out safe-haven assets.
During election years, you’ll likely see:
- Increased gold demand as a hedge.
- A slowdown in risky asset investments.
- A rise in volatility in the broader market.
Yes, depending on the political climate and market sentiment. In some cases, a perceived 'stable' election outcome or clear policies may reduce uncertainty and lead to less demand for gold. If investors feel confident about economic growth or a positive policy shift, gold prices could fall as they return to riskier assets.
The impact of a Republican or Democratic win can vary, but typically:
- Democratic Wins: Gold prices often rise due to expectations of more government spending, higher taxes, and potential inflationary pressures.
- Republican Wins: Gold may dip slightly as markets often anticipate lower taxes, less regulation, and more favorable conditions for business growth.
Predicting exact gold prices during the 2024 election can be tricky due to the many variables involved, including political events, economic policies, and unforeseen global issues. However, investors can look to historical patterns, market trends, and economic forecasts to get an idea of how gold might behave.
Factors to watch for in 2024 include:
- Potential economic policy shifts under a new president.
- Global economic stability or turmoil.
- The direction of inflation and interest rates.
During elections, it’s key to approach gold investment with a long-term perspective, rather than reacting to short-term market swings. Consider diversifying your portfolio and hedging against risks by holding physical gold or gold-related assets like ETFs.
Some tips for investing in gold during elections:
- Monitor the political landscape closely.
- Buy physical gold (coins or bars) or invest in gold-backed ETFs.
- Diversify to balance risk—don't rely solely on gold.
Uncertainty surrounding the outcome of a US presidential election can drive investors toward gold as a form of protection. In periods of heightened uncertainty, gold often sees price increases as investors seek a stable store of value. This reaction is rooted in the historical behavior of the market during times of political volatility.
Uncertainty typically leads to:
- Increased demand for safe-haven assets.
- Price fluctuations based on changing political dynamics.
- A rise in gold purchases as a hedge against instability.


