Table of contents
If you’ve ever felt lost in a sea of market indicators, you’re not alone. Enter the Ichimoku Kinko Hyo, a powerful tool that gives traders a clear snapshot of the market with just one glance. Developed by Japanese journalist Goichi Hosoda, it’s like having a map that shows you the road, speed bumps, and traffic signals all at once.
This system isn't just for experts; it helps anyone, from beginners to seasoned traders, find key levels of support and resistance, spot trends, and gauge momentum. Think of it as your GPS for the financial world. It takes the guesswork out and lets you focus on making smarter trades.
In short, Ichimoku is here to save you time and stress. As one expert puts it, "It's like putting on glasses—everything becomes clearer." With this tool in your corner, you’ll be able to navigate the market with confidence.

What is Ichimoku Kinko Hyo?
The Ichimoku Kinko Hyo is a comprehensive trading indicator designed to give traders a quick and clear view of the market. With its unique ability to highlight trends, momentum, and support/resistance zones, it’s often referred to as a “one-glance” tool, making it invaluable for traders of all levels.
History and Origins of Ichimoku
Ichimoku Kinko Hyo was developed in the 1960s by Goichi Hosoda, a Japanese journalist who sought to create an indicator that could give traders a complete market view with just a glance. Hosoda’s inspiration came from the evolving landscape of charting tools in Japan during the 1930s. He introduced Ichimoku through a newspaper series, aiming to simplify complex market analysis. The term “Ichimoku” translates to “one glance,” which perfectly describes the indicator’s core feature — it allows traders to see the market’s equilibrium quickly. The Kumo (Cloud), a key component of Ichimoku, was designed to show support and resistance, giving traders an easy way to assess price movement without needing to analyze every detail on a traditional chart.
Purpose and Overview of Ichimoku Kinko Hyo
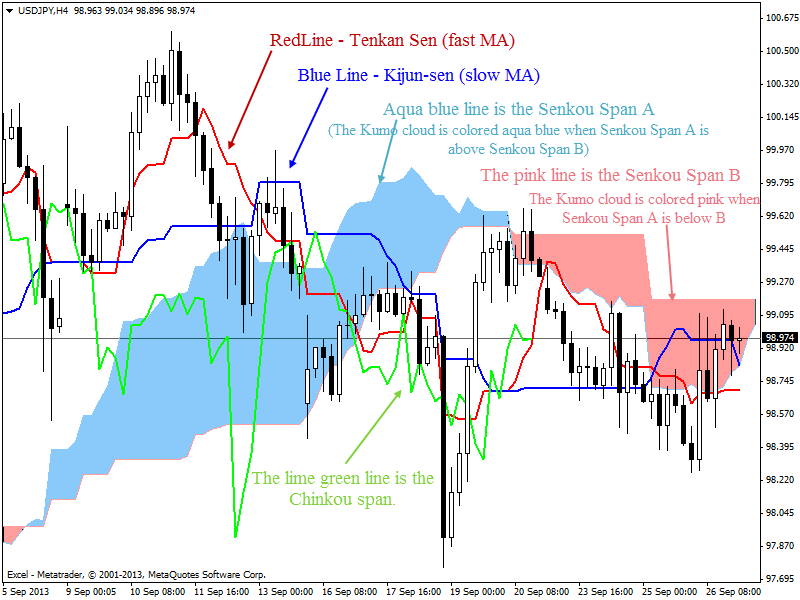
Ichimoku Kinko Hyo provides traders with a balanced view of the market by using five main components:
Kumo (Cloud): The heart of Ichimoku, it represents areas of support and resistance, allowing traders to visually gauge whether the market is bullish or bearish.
Tenkan-sen (Conversion Line): A fast-moving line that highlights short-term price trends, showing how quickly price is changing.
Kijun-sen (Base Line): A slower-moving line that reveals the overall trend direction, helping traders confirm the long-term market trend.
Senkou Span A & B: These lines form the Kumo’s boundaries, providing future support and resistance levels based on past price data.
Chikou Span (Lagging Span): This line helps confirm the current trend’s strength by comparing the current price with the price 26 periods ago.
Together, these components form a visual, easy-to-read chart that helps traders understand the market’s balance, or equilibrium, at a glance. The goal of Ichimoku is to show the relationship between price and these elements, offering insight into trend direction, momentum, and where the price may find support or resistance.
Why Traders Use Ichimoku Kinko Hyo
Traders use Ichimoku Kinko Hyo for its ability to provide all-in-one analysis.
Trend confirmation: The Tenkan-sen and Kijun-sen help confirm short- and long-term trends, giving traders confidence in their positions.
Momentum analysis: By examining the position of the price relative to the Kumo, traders can gauge market momentum — whether the market is moving up or down.
Entry and exit points: The Chikou Span and Kumo breaks signal potential entry and exit points, helping traders know when to buy or sell.
One of the key advantages of Ichimoku is its ability to provide a multi-timeframe view, enabling traders to see market conditions across various time horizons. It is particularly popular for Forex trading, but its versatility makes it effective across different asset classes, including stocks and crypto. By combining Ichimoku with other indicators like RSI or MACD, traders can increase their forecasting accuracy and fine-tune their risk management strategies. This makes Ichimoku not just an indicator, but a full trading strategy tool.
How Ichimoku Works
The Ichimoku Kinko Hyo might seem complicated at first, but once you get the hang of its structure, it becomes a really useful tool. It’s built to give you a broad view of market trends and signals all at once, which can help you make smarter trading decisions. Let’s take a deeper dive into how it works!
Understanding Ichimoku's Structure
Ichimoku is built on five core components that each serve a unique purpose. Here’s a quick breakdown of what each component does:
| Component | Description |
|---|---|
| Tenkan-sen | Also known as the Conversion Line. It’s a short-term moving average that helps indicate momentum. |
| Kijun-sen | The Base Line. This one’s a longer-term moving average that gives a sense of trend direction. |
| Senkou Span A/B | These lines create the cloud (Kumo). They help identify future support or resistance levels. |
| Chikou Span | The Lagging Line. It shows where the current price stands relative to past prices, helping indicate potential trend reversals. |
Each of these lines interacts in specific ways to give you a clearer view of what’s happening with a particular asset. When they cross, or when the price interacts with the cloud, it can indicate various market signals.
How the Cloud Indicates Market Trends
One of the most powerful features of Ichimoku is the Cloud (or Kumo). It’s made up of two lines—Senkou Span A and Senkou Span B—and its purpose is to show the market's trend direction and strength at a glance.
Here’s how to interpret the cloud:
Bullish Market: If the price is above the cloud, the trend is considered bullish. It’s a sign that buyers are in control.
Bearish Market: If the price is below the cloud, the trend is bearish. Sellers are in control.
Cloud Thickness: The thicker the cloud, the stronger the trend. A thin cloud indicates weaker support/resistance, while a thick cloud signals a strong trend.
The cloud also serves as dynamic support or resistance. If the price is approaching the cloud from above, it may act as a support level, preventing the price from falling lower. If the price is approaching from below, it could act as resistance, stopping price from moving higher.
Reading Ichimoku for Momentum
Ichimoku is also excellent for gauging momentum. You can look at the Tenkan-sen and Kijun-sen crossovers to help you spot momentum shifts.
Here’s how to read it:
Bullish Crossover: If the Tenkan-sen (shorter moving average) crosses above the Kijun-sen (longer moving average), this signals upward momentum. This is often seen as a buying opportunity.
Bearish Crossover: If the Tenkan-sen crosses below the Kijun-sen, it signals a downtrend, which can be a time to sell or stay out of the market.
The Gap: The bigger the gap between these lines, the stronger the momentum. A wide gap means that the trend is moving quickly, while a narrow gap suggests slower movement or consolidation.
If you’re trading in the direction of the cloud, this can give you added confidence that the momentum is aligned with the overall trend.

Analyzing Time Frames in Ichimoku
One of the best features of Ichimoku is that it works on different time frames, whether you’re a day trader looking for quick moves or a swing trader holding positions for days or weeks. Let’s break it down:
Short-Term Time Frames: On smaller time frames (like 5-minute or 15-minute charts), Ichimoku helps identify quick trend reversals or price breakouts. These signals can be used for fast entry and exit points.
Long-Term Time Frames: On longer time frames (like daily or weekly charts), Ichimoku helps you spot the overall trend and gives you a more strategic view of the market. This is especially useful for swing trading.
Multiple Time Frame Analysis: By analyzing multiple time frames, you can get a better sense of both the short-term and long-term trend. This method helps you time entries and exits more effectively. For example, you might use a longer time frame to spot the main trend and a shorter one to fine-tune your entry.
By combining signals from multiple time frames, you get a better, more reliable view of market movements.
This cluster has covered how Ichimoku works at a deeper level. By understanding its structure, interpreting the cloud for trend signals, analyzing momentum, and using time frames effectively, you’ll have a solid foundation to start applying Ichimoku in your trading.
Key Components of Ichimoku

Tenkan-sen and Kijun-sen Explained
The Tenkan-sen (Conversion Line) and Kijun-sen (Base Line) are two of the most crucial lines in Ichimoku Kinko Hyo. The Tenkan-sen reflects the short-term trend by calculating the midpoint of the highest and lowest prices over the last 9 periods. It shows where the market has been moving in the immediate past. The Kijun-sen, calculated over the last 26 periods, represents the medium-term trend, offering a broader view of price movements.
When the Tenkan-sen crosses above the Kijun-sen, it signals a potential bullish trend, suggesting upward momentum. Conversely, if the Tenkan-sen crosses below the Kijun-sen, it indicates a possible bearish trend. This crossover strategy is widely used in trading as a strong signal to enter or exit trades.
The Role of Senkou Span A/B
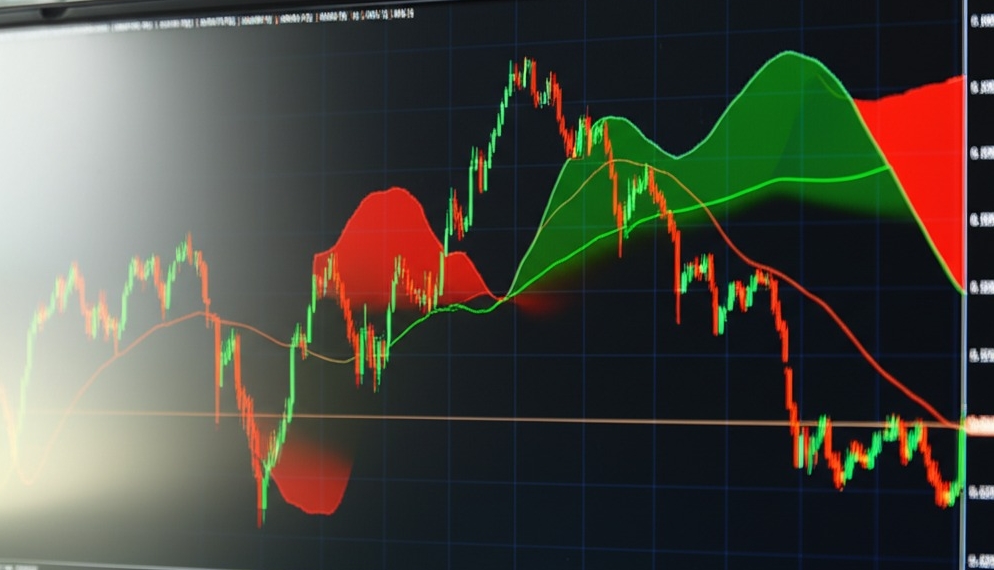
1. Senkou Span A and Senkou Span B are two of the most important lines in the Kumo (Cloud). Senkou Span A, the faster line, is calculated by averaging the Tenkan-sen and Kijun-sen, and it forms one edge of the cloud. Senkou Span B, the slower line, is calculated as the average of the highest and lowest prices over the last 52 periods, and it forms the other edge of the cloud. Together, these two spans create a dynamic support and resistance area, which shifts based on market trends.
2. The Kumo (Cloud), formed by the Senkou Span A and Senkou Span B, represents future price action. When the price is above the cloud, the market is in an uptrend, indicating a strong bullish condition. If the price is below the cloud, it suggests a downtrend, signaling bearish market conditions. The Kumo also provides valuable insight into potential breakouts or reversals. A price break above or below the cloud typically signals a strong shift in market direction.
The Significance of Chikou Span
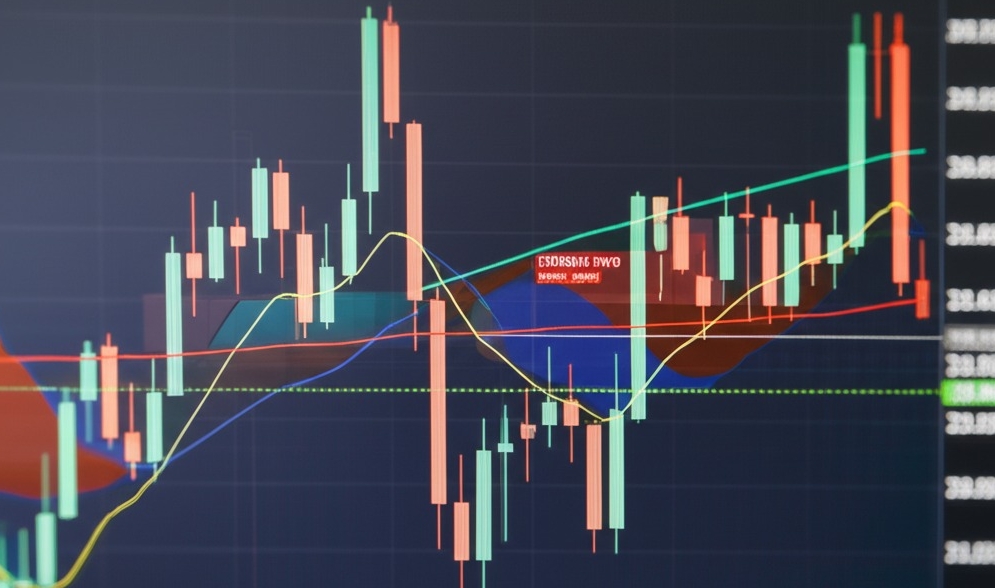
The Chikou Span (Lagging Span) is a vital component of Ichimoku Kinko Hyo. This line represents the current price plotted 26 periods behind, which helps compare the present price action with past price levels. The Chikou Span is used to confirm trends. If the Chikou Span is above the price, it suggests the market is in a bullish trend, and if it’s below the price, the market is likely bearish.
What makes the Chikou Span particularly useful is its ability to confirm whether a trend is strong. If the Chikou Span is consistently above or below the price, it shows momentum in that direction. It can also be used to spot potential reversals when the Chikou Span crosses over or under the price.
Cloud Visualization and Price Action
1. Kumo (Cloud) is one of the most unique aspects of Ichimoku Kinko Hyo. It serves as a visual indicator of support and resistance, giving traders a clear view of the market's directional bias. When price is trading above the cloud, it’s generally an indication of an uptrend. On the other hand, prices below the cloud indicate a downtrend.
2. The cloud’s thickness and shape provide crucial insights into the market's strength. A thicker cloud suggests that support or resistance is strong, making price reversals less likely. A thin cloud indicates weak support/resistance, which might suggest a breakout or reversal could occur. If the price breaks through the cloud, it can be a strong signal of a trend continuation or reversal.
How Components Signal Market Changes
The combination of all the Ichimoku components provides powerful signals that help traders anticipate market movements. When the Tenkan-sen crosses over the Kijun-sen, it often signals a trend reversal. Likewise, when the price breaks above or below the Kumo (Cloud), it indicates that a significant change in market direction is likely.
Key Ichimoku signals include crossovers (between the Tenkan-sen and Kijun-sen), cloud breaks, and Chikou Span positioning. A cloud break or a crossing of the Tenkan-sen above the Kijun-sen can signal the beginning of a new trend or a reversal, while the Chikou Span provides confirmation of the trend's momentum. These signals, when combined, give traders a comprehensive view of the market’s potential.
| Component | Purpose | Market Signal |
|---|---|---|
| Tenkan-sen | Represents short-term trend | Cross above = Bullish; Cross below = Bearish |
| Kijun-sen | Represents medium-term trend | Cross above = Bullish; Cross below = Bearish |
| Senkou Span A | Forms one edge of the Cloud (support/resistance) | Price above = Uptrend; Price below = Downtrend |
| Senkou Span B | Forms the other edge of the Cloud | Price above = Uptrend; Price below = Downtrend |
| Chikou Span | Compares current price with past price levels | Above price = Bullish; Below price = Bearish |
| Kumo (Cloud) | Visual representation of support/resistance | Price above = Uptrend; Price below = Downtrend |
Interpreting Ichimoku Signals
The Ichimoku Kinko Hyo provides powerful signals to help you make smarter trading decisions.
Bullish and Bearish Crossovers
A bullish crossover happens when the Tenkan-sen (conversion line) crosses above the Kijun-sen (base line), signaling upward momentum. On the flip side, a bearish crossover occurs when the Tenkan-sen falls below the Kijun-sen, indicating potential downside risk. These crossovers are essential for spotting trend shifts. Example: A golden cross (bullish) and death cross (bearish) are key indicators of market direction.
Cloud Breakouts and Reversals
When price moves above the Ichimoku Cloud (Kumo), it signals an upward trend. A breakout above the cloud means potential buying opportunities, while a breakdown below indicates selling pressure. Pay close attention to the Senkou Span A and Senkou Span B for potential reversals. The Kumo is your visual guide to support and resistance.

How to Spot Ichimoku Patterns
Spotting Ichimoku patterns is like reading the market’s body language. Tenkan-sen and Kijun-sen crossovers, Kumo twists, and the Chikou Span give you clues. When the Chikou Span is above the price, it's a sign of strength; below, a sign of weakness. Understanding these patterns gives you a clear strategy for entering or exiting trades.
Support and Resistance in Ichimoku
Support and resistance are key elements in technical analysis. Ichimoku Kinko Hyo offers a unique approach to identifying these zones, helping traders make better decisions. Let’s dive into how this works.
Using Ichimoku to Spot Support Zones
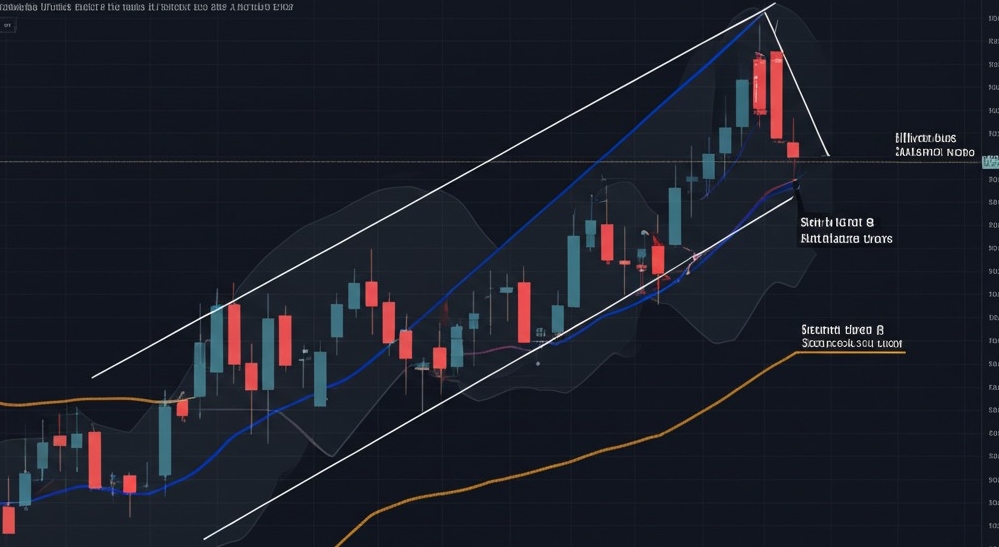
Ichimoku Kinko Hyo makes spotting support zones much easier. When the price action approaches the Kijun-sen or Senkou Span B, it’s often a sign of a potential support level. The cloud also provides a visual cue, with prices bouncing off its lower edge. Traders rely on this indicator to predict where prices might hold steady or reverse.
Key points to remember:
Kijun-sen is often a reliable support level.
Senkou Span B forms a strong support zone within the cloud.
Watch for price action bouncing off these levels.
How Resistance is Identified with Ichimoku
Resistance zones can be easily identified with Ichimoku Kinko Hyo, especially when price action nears the Tenkan-sen or Senkou Span A. The cloud acts as a barrier, with the upper edge marking potential resistance. As price approaches these levels, it’s time to watch for reversals or a breakout. By observing how the market interacts with these points, traders can better time their entries or exits.
Pro tips:
Tenkan-sen often signals immediate resistance.
Senkou Span A provides a stronger resistance level.
Price interaction with the cloud shows where resistance may occur.
Ichimoku in Forex Trading
Ichimoku Kinko Hyo isn't just for stocks—it's a game-changer in Forex trading, too. Whether you're looking for trend reversals, key entry points, or ways to spot market momentum, Ichimoku offers clarity and precision.

Ichimoku for Trend Reversal in Forex
Ichimoku Kinko Hyo is fantastic for spotting trend reversals in Forex. Look for Kumo breakouts, Tenkan-sen and Kijun-sen crossovers, and the Chikou Span confirming a shift in price action. These signals combine to give you a strong indicator of when a market is about to flip, helping you catch those key turning points early. Just make sure the Senkou Span aligns to confirm the new direction!
Applying Ichimoku to Currency Pairs
Applying Ichimoku to currency pairs can be a game-changer. By observing the Kumo (cloud) and the Tenkan-Kijun cross, you get clearer insights into the market’s momentum. Chikou Span confirmation solidifies your analysis, giving you confidence in your trades.
Kumo Breaks & Support-Resistance Levels
Watch for Kumo breaks—they show potential market shifts. Pair them with support and resistance levels to strengthen your trading strategy. When the cloud moves past these levels, it could mean an upcoming price move.
Trading Strategy for Major & Cross Pairs
Whether you're focusing on major pairs like EUR/USD or exploring cross pairs, Ichimoku can be your reliable guide. Use it to track trends and spot entry points, making your Forex trading more efficient.
Identifying Key Entry and Exit Points
Spot entry points by looking for crossovers of the Tenkan-sen and Kijun-sen, or when the price breaks the Kumo edge. These signals show the market is primed for movement. Combine these with Chikou Span confirmation to get even more confident.
Exit Points & Risk Management
For exit points, keep an eye on price action and Ichimoku signals like Kijun-sen crossovers or Senkou Span breakouts. A good strategy is to set your stop loss and take profit levels based on these points to manage risk and maximize gains.
How to Use Ichimoku with Forex Indicators
Use Ichimoku alongside Moving Averages to refine your strategy. When Tenkan-sen crosses above the moving average, it’s a strong bullish signal. This combination helps to confirm trends.
RSI and Ichimoku Synergy
Pair RSI with Ichimoku to improve signal confirmation. If Ichimoku gives a bullish signal and RSI is showing oversold conditions, your entry point is likely solid.
MACD & Bollinger Bands with Ichimoku
Add MACD and Bollinger Bands to your Ichimoku setup for a broader view. MACD confirms momentum, while Bollinger Bands help you track volatility, creating a comprehensive trading system.
Benefits of Ichimoku
The Ichimoku Kinko Hyo system isn’t just for trend tracking. It’s a full-fledged tool for market analysis, precision trading, and managing risk.
All-in-One Market Analysis
Ichimoku is like having a one-stop shop for all your market analysis needs. It combines multiple indicators into a single, easy-to-read chart. Traders can quickly spot trends, identify potential support and resistance zones, and get a good feel for momentum—all in one glance. It cuts through the noise of other indicators and streamlines the trading process. Instead of juggling multiple charts, Ichimoku simplifies everything, providing a comprehensive view that can be understood in seconds.
Trend identification: Ichimoku shows if the market is trending up, down, or sideways.
Support and resistance: The system marks key levels, helping traders identify where price may stall or reverse.
Momentum measurement: With its cloud, Ichimoku gives a clear picture of market momentum.
| Ichimoku Feature | Benefit | How It Helps Traders |
|---|---|---|
| Tenkan-sen and Kijun-sen | Signals price momentum and trend direction | Helps traders decide when to enter or exit trades |
| Senkou Span A/B (Cloud) | Determines market trends and support/resistance levels | Reduces confusion and supports decision-making |
| Chikou Span | Shows price action relative to the market | Confirms trend strength and signals entry/exit |
Increased Trading Accuracy with Ichimoku
When it comes to trading, precision is key, and Ichimoku helps you get it right. By combining several indicators into one, it sharpens the accuracy of your trade signals. The bullish and bearish crossovers that Ichimoku provides are some of the clearest indicators out there. These crossovers act as "green lights," showing you the best times to enter or exit trades. It’s like getting a heads-up from the market, helping you make decisions with confidence.
Crossovers: The crossing of the Tenkan-sen and Kijun-sen lines indicates strong buy or sell signals.
Cloud breakouts: Price breaking through the cloud is often a strong confirmation of the trend.
Chikou Span confirmation: If the Chikou Span is above the price, the trend is likely bullish; if it’s below, bearish.
This combination makes it much easier to predict price movements with greater confidence. The more accurate your predictions, the higher your chances of successful trades.

Efficient Risk Management Using Ichimoku
Risk management is one of the most important aspects of trading, and Ichimoku has you covered. With its clear trend indicators and support/resistance levels, it’s easy to set stop-loss orders and control risk. By defining entry points and potential price reversals, Ichimoku gives traders the data they need to determine position sizing. It helps avoid significant losses while keeping you in the game.
Setting stop-losses: With clear support and resistance zones, you can set stop-loss orders more precisely, reducing risk exposure.
Position sizing: Ichimoku helps optimize trade size, protecting against large drawdowns.
Market volatility: By analyzing price behavior relative to the cloud, you can gauge potential volatility and adjust your trading strategy accordingly.
This reduces the likelihood of emotional trading decisions and helps protect your capital.
The Ichimoku Kinko Hyo is more than just a trend-following tool. It offers a well-rounded approach to trading by providing in-depth market analysis, improved trade accuracy, and a solid risk management framework. For those looking for a comprehensive, one-stop solution for trading, Ichimoku is a game-changer.
Combining Ichimoku with Other Indicators
Using Ichimoku with RSI for Confirmation
When using Ichimoku Kinko Hyo with the RSI (Relative Strength Index), you're looking for extra confirmation of trend strength or reversal. If RSI shows that a market is overbought or oversold, and Ichimoku's Cloud is aligning with these signals, it adds credibility to the potential market shift.
- For instance, when the Senkou Span A (leading span) crosses above Senkou Span B, indicating a bullish trend, and RSI shows overbought conditions (above 70), the likelihood of a price pullback is higher.
- RSI in oversold territory (below 30), combined with Ichimoku’s bullish setup, may indicate that the market is about to reverse from a downtrend to an uptrend.
| Indicator | Signal Type | Confirmation Scenario |
|---|---|---|
| RSI | Overbought (above 70) | Watch for trend reversal with Senkou Span A/B crossover |
| RSI | Oversold (below 30) | Look for a bullish signal with Ichimoku Cloud above the price |
MACD and Ichimoku: A Powerful Combo

The combination of MACD (Moving Average Convergence Divergence) with Ichimoku gives traders a highly reliable way to spot trends and reversals. MACD helps you spot momentum shifts with its histogram and signal line, while Ichimoku shows the overall trend and potential support or resistance.
- A bullish crossover on the MACD (when the MACD line crosses above the signal line) combined with the price above the Kumo (Cloud) is a strong buy signal.
- On the other hand, a bearish crossover when the MACD line drops below the signal line, alongside price action breaking below the Cloud, signals a strong downtrend.
Adding Moving Averages to Ichimoku
Pairing Moving Averages (such as SMA or EMA) with Ichimoku helps traders identify key support/resistance levels and confirm trend direction. When Ichimoku’s Tenkan-sen (conversion line) crosses above a moving average, it signals a potential buy, and when it crosses below, it signals a possible sell.
- A Simple Moving Average (SMA) can act as an additional level of support or resistance. If the price is above the SMA and also above the Kumo, it confirms a strong uptrend.
- Exponential Moving Averages (EMA) offer more sensitivity to recent price changes, which, when combined with Ichimoku, can improve entry and exit timing.
| Indicator | Signal Type | Confirmation Scenario |
|---|---|---|
| Moving Average (SMA) | Price above SMA | Confirmation of uptrend with Ichimoku Cloud above price |
| Moving Average (EMA) | Price below EMA | Confirmation of downtrend with Ichimoku Cloud below price |
Ichimoku and Fibonacci Retracement
Using Fibonacci retracement levels alongside Ichimoku helps traders pinpoint potential support and resistance levels more accurately. Fibonacci levels often align with important Kumo boundaries, offering a stronger confirmation of market movements.
- When the price hits a Fibonacci retracement level and it coincides with the Kijun-sen or Senkou Span B, it provides a strong level of support or resistance.
- The Golden Ratio (61.8%) in Fibonacci often aligns with key Ichimoku Cloud levels, enhancing the likelihood of a price bounce or reversal.
| Fibonacci Level | Ichimoku Confirmation | Trading Implication |
|---|---|---|
| 61.8% | Senkou Span B or Kijun-sen | Strong support or resistance |
| 50% | Tenkan-sen crossing above | Possible bullish reversal |
How to Integrate Ichimoku with Volume Indicators
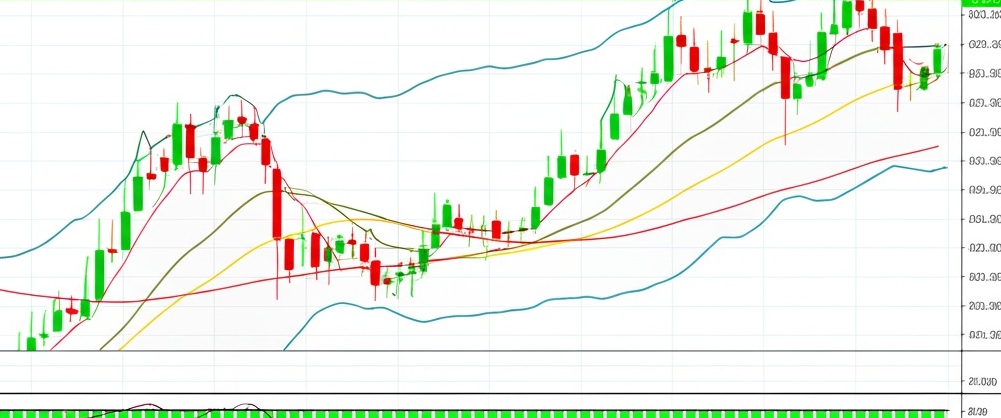
By combining Ichimoku with volume indicators like On-Balance Volume (OBV) or Accumulation/Distribution, you get a more comprehensive view of the market’s trend strength. If OBV supports the price movement that Ichimoku indicates, you can be more confident in the trade's direction.
- If the price is above the Cloud and OBV is rising, it confirms a strong buying trend.
- Conversely, if the price is below the Cloud and OBV is decreasing, the downtrend is likely gaining strength.
Advanced Strategies: Ichimoku + Price Action
For more experienced traders, combining Ichimoku with Price Action offers a powerful approach. Price Action relies on candlestick patterns and chart formations like support, resistance, trend lines, and breakouts, while Ichimoku confirms the trend’s overall direction.
- Look for Doji or Engulfing patterns within the Kumo to signal a potential breakout.
- A breakout above the Cloud, confirmed by a price action pattern like a bullish engulfing, can be a powerful entry signal.
Conclusion
Ichimoku Kinko Hyo is more than just a fancy charting tool—it's your trading compass, helping you spot trends, predict support and resistance, and make smarter decisions. Once you get the hang of its components, it can really up your trading game.
The beauty of Ichimoku is how it simplifies complex market info into clear, actionable signals. As trader Joe Ross puts it, “It gives you a whole picture, not just a snapshot.”
Start using Ichimoku today, and watch your trades become more confident and informed.
The Ichimoku Cloud is a powerful technical indicator used to identify market trends, support, resistance levels, and momentum. It's composed of multiple elements that work together to give traders a clear picture of what’s happening in the market. Traders use it for quick trend analysis, spotting reversals, and determining optimal entry and exit points.
To use Ichimoku for trend analysis, you’ll need to pay attention to the Cloud (Kumo), which is the heart of the system. The basic rule is:
This simple rule gives a quick overview of market direction, and it can be used across different timeframes for both short-term and long-term trading.
Bullish trend: Price is above the Cloud.
Bearish trend: Price is below the Cloud.
Neutral trend: Price is inside the Cloud.
The Ichimoku indicator consists of five key components:
Together, these components give a well-rounded view of the market's momentum, direction, and support/resistance levels.
Tenkan-sen (Conversion Line): Short-term average, gives fast signals.
Kijun-sen (Base Line): Longer-term average, shows more stable trends.
Senkou Span A and B: Create the Cloud, help identify support/resistance.
Chikou Span (Lagging Line): Shows the historical closing price and confirms trends.
Ichimoku is widely used in Forex trading for several reasons:
Traders love the 'one-glance' approach of Ichimoku, which allows them to make quicker and more informed decisions in the fast-paced Forex market.
Clear trend identification: The Cloud helps identify whether a currency pair is in an uptrend, downtrend, or sideways movement.
Support and resistance levels: The indicator shows where the price may encounter barriers.
Comprehensive analysis: It combines trend-following, support/resistance, and momentum in one tool, saving time.
Yes, Ichimoku Kinko Hyo can absolutely be used for stock trading. Just like in Forex, it helps stock traders identify trends, support and resistance levels, and key turning points. The indicator works across all timeframes and markets, making it versatile for any asset class.
When the Tenkan-sen (Conversion Line) crosses above the Kijun-sen (Base Line), it typically signals a bullish crossover, indicating potential buying opportunities. Conversely, when the Tenkan-sen crosses below the Kijun-sen, it signals a bearish crossover, suggesting a possible sell or short position.
These crossovers are key signals for traders looking to capitalize on short-term trend shifts.
The Chikou Span, or Lagging Line, is an important component of the Ichimoku system. It reflects the closing price, shifted back 26 periods, and serves as a confirmation tool:
It helps confirm the trend, and when used in conjunction with other components, provides a clearer picture of market momentum.
If the Chikou Span is above the price, the market is considered bullish.
If the Chikou Span is below the price, it signals a bearish market.
Integrating Ichimoku with other indicators can help refine your strategy. Here are a few ways to combine them:
By layering multiple tools, traders can improve the accuracy of their entry and exit points.
RSI (Relative Strength Index): Use RSI to confirm the strength of a trend identified by Ichimoku.
MACD (Moving Average Convergence Divergence): Pair it with Ichimoku for identifying potential reversals.
Moving Averages: Combine with Ichimoku to get a better idea of longer-term trends.
Ichimoku is known for being reliable in identifying market reversals, especially when combined with other indicators. The key signals to watch for are:
However, no indicator is perfect, so always combine Ichimoku signals with other confirmation tools to reduce false signals.
Price breaking through the Cloud: This often indicates a reversal.
Chikou Span crossover: When it crosses above or below the price, it can confirm a reversal.
Support and resistance levels: The Cloud often marks these zones, where reversals can happen.


