SILVER TRADING
As discussed in the ‘what is silver’ article, silver is a precious metal which is predominately used for industrial purposes, but it is also one of the most popular tradeable commodities. Although gold is perceived to hold more economic value, these two commodities are highly correlated and both fall into the category of safe-haven assets.
During periods of high volatility and economic uncertainty, investors have often sought refuge in silver as an inflationary hedge as well as a long-term investment, increasing its safe-haven appeal. Much like its Gold counterpart, there is an inverse relationship between silver and the US Dollar, making it an attractive investment for the purpose of portfolio diversification.
As with any financial instrument, it is important to understand the factors that may influence the price of Silver and in turn, its investment appeal.
Advertisement
Three Factors which Influence Silver as an Investment:
Supply and Demand
Although all assets are a function of supply and demand, precious metals are often in high demand due to the limited supply available. However, the demand for silver is largely attributed to its industrial application. Because silver is the most electrical and thermally conductive metal, it is often used for medical equipment, electrical appliances and other industrial items.
During economic slumps, although the demand for physical silver as an industrial item may decrease, the demand for it as an investment often increases, resulting in an increase in price. As far as supply is concerned, a majority of industrial silver is either consumed or destroyed during the fabrication process, limiting the supply that can be returned to the market upon completion of the industrial cycle and potentially hindering future supply of the metal.
2. Global Economics
In periods of economic uncertainty and political instability, investors have been known to invest in gold, but silver’s safe-haven appeal is definitely gaining the attention of many investors as an alternative. During a global recession, adjustments to monetary and fiscal policies often result in investors looking towards alternate investments that may yield higher returns as governments often lower interest rates to stimulate consumer spending, simultaneously increasing inflation expectations. While rising inflation results in a loss of purchasing power with paper money and a depreciation in currencies, investors may use silver as an inflationary hedge against such losses. In addition to this, silver, like gold, often displays an inverse relationship with the US Dollar. As the Dollar weakens, the demand for silver is likely to grow as traders diversify their portfolios to mitigate the risk associated with Dollar depreciation.

RECOMMENDED BY RICHARD SNOW
Download the latest USD forecast
Get My Guide
Gold Prices
Throughout this article, the relationship between gold and silver has been mentioned numerous times, and is represented by the gold-silver ratio, the measurement used to determine the amount of silver (in ounces) that one would need to buy one ounce of gold. Although the price of silver tends to follow that of gold, it does not mean that the two commodities will move at the same rate, and these discrepancies will likely either increase or decrease the ratio level. However, understanding the gold-silver ratio may be beneficial for silver traders as it may provide potential signals of when the market is reaching extreme levels.
From a historical perspective, during the financial crisis, gold had a tendency of outperforming silver which meant that the ratio would increase, with highs breaching 80 and lows sinking to around 40. At these extreme levels, traders may be looking for additional confirmation that a correction will occur to bring the ratio back to its perceived normal level of around 60.
SILVER AS A TRADEABLE COMMODITY
Ample liquidity, high trade volumes, tight spreads and flexible trading hours are attractive attributes which make silver a popular commodity for traders. When market volatility increases, a smaller market size makes silver more susceptible to large price swings which will often be greater than that of gold. For short-term traders, such as day traders or scalpers, this may be an opportunity to take advantage of the large price swings that may occur.
In addition to this, silver is becoming increasingly popular as a means of portfolio diversification, with traders using it as a hedge against positions with a high correlation to the US Dollar and the same factors that influence silver as an investment will generally impact it as a tradeable commodity.
SILVER TRADING STRATEGIES
Although a variety of strategies exist, it is important that the strategy chosen, is in alignment with current market conditions. When the market is in a trending phase, traders may apply a Trend Trading strategy and when in a rangebound state, a Range Trading strategy may be used.
3 Steps to a Silver Trend Trading Strategy:
Determine the direction of the trend
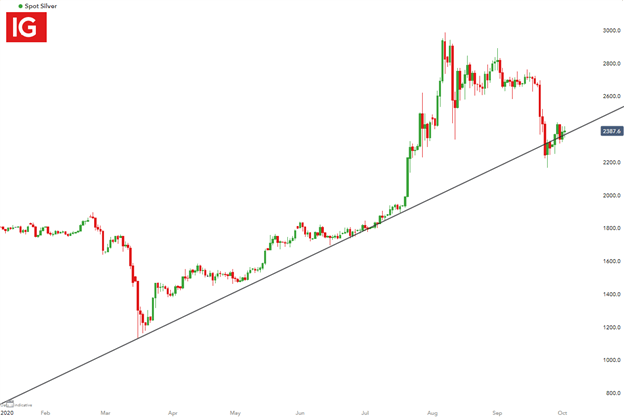
A trending market is one that is consistently reaching new extremes. In an uptrend, this would be characterized by a series of higher highs and higher lows, while a strong downtrend trend would be characterized by a series of lower lows and lower highs.
Although determining the trend may sound simple, deciding on an appropriate time-frame can be a challenging task. While intraday traders often make use of short-term charts to determine potential entry and exit signals, there are benefits to multiple time-frame analysis, which includes analysis from both long and short-term charts. As depicted on the daily chart below, a trendline can be used as a guide to determine the direction of the trend, with three touching points confirming the presence of the upward trend.

RECOMMENDED BY RICHARD SNOW
Introduction to Forex News Trading
Get My Guide
Silver Daily Chart

2. Filter signals in the direction of the trend
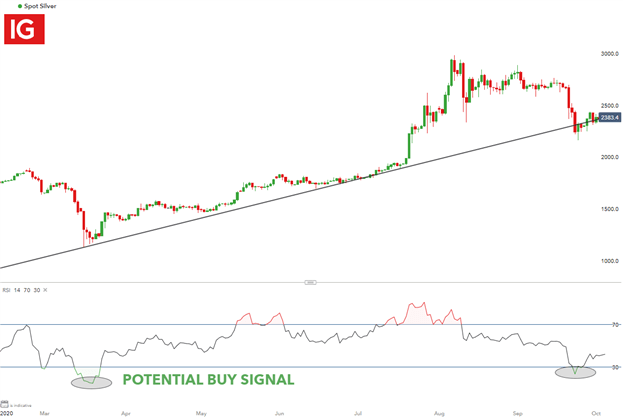
Once the trader has identified the direction of the current trend, the second step would be to identify potential entry signals by making use of technical indicators. The Relative Strength Index (RSI), is a popular momentum oscillator that indicates when an instrument may be overbought or oversold. When the value of the RSI falls below 30, it is considered oversold and when it is above 70, it is considered overbought.
By applying the RSI to the daily chart above, a potential entry signal may exist at the highlighted areas below 30, where silver is considered to be in oversold territory.

3. Implement risk management
Risk management is probably the most important component of a trading plan which should be determined prior to entering a trade.
At DailyFX Education, risk management is front and center as this is one of the few factors that a trader actually has in their control. This is also derived from data, featured in our Traits of Successful Traders research. Point blank – no trader will even be able to accurately predict the future much less in a perfect manner. And with that being the case, any trader that isn’t controlling the size of their losses is vulnerable to one ‘bad’ trade wiping out the gain from numerous ‘winning’ trades. To learn more about our risk management and our Traits of Successful Traders research, click on the link below:
RECOMMENDED BY RICHARD SNOW
DailyFX Traits of Successful Traders Research
Get My Guide
Silver Range-bound Trading Strategy
The silver market does not always trend upwards or downwards, it often enters periods of consolidation when the prices move ‘sideways’, which is when a range-bound strategy would be suitable.
A range-bound strategy may be implemented by using a similar three-step process as above.
Determine the range
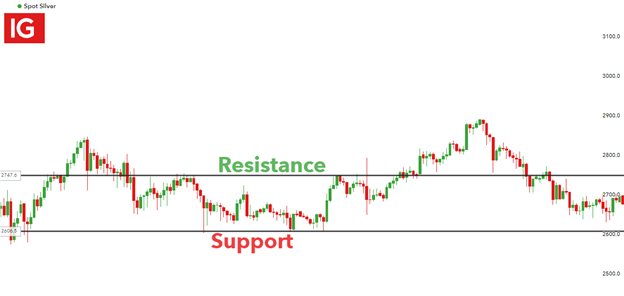
When price action is in a range-bound state, it generally means that prices are reaching the same levels over a period of time, which is referred to as a consolidation. To determine the range, a trader may use support and resistance levels to assist in identifying the upper and lower limits within the range. A support zone can be established by connecting a series of lows while a resistance zone can be established by connecting a series of highs.
The silver two-hour chart below demonstrates how a trader may determine the range when the market is in a period of consolidation.
Silver 2 Hour Chart

2. Filter signals
If the silver price moves to the bottom of the range, traders could look to buy silver and could look to sell silver when the price moves to the higher end of the range. An advantage of a range trading strategy is that a trader can use tight stop-losses. This means that a trader can risk less and generally aim for a higher risk-reward ratio on the trade.
3. Implement risk management
Any complete trading strategy will include strict risk-management principles. If the silver price breaks out of the support or resistance levels, which it eventually will, it is important that a trader is prepared. Traders can use stop-losses and take-profits to predetermine the risk-reward ratio before entering a trade.
If a trader sells silver at a resistance level they would place their stop-loss above the resistance level, and likewise if a trader bought silver they would place their stop-loss below the support level.
HOW TO TRADE SILVER WITH TECHNICAL ANALYSIS
The strategies above focused on the use of chart patterns and technical indicators to assist with determining possible points of interest, which, although cannot be guaranteed, may assist traders in identifying high probability areas, that have proven to be important in the past.
Although hundreds of indicators exist, each with unique characteristics, the use of one or two simple indicators is often sufficient.
Four effective indicators that are used by both novice and experienced traders include the moving average (MA), relative strength index (RSI), the moving average divergence/convergence (MACD) and the stochastic.
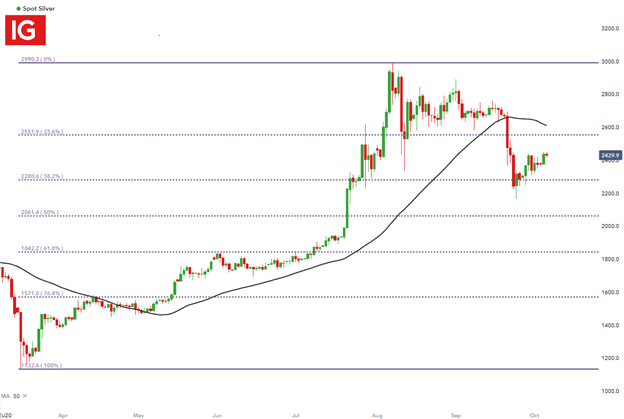
However, price action is also useful guide for traders, with Fibonacci levels guiding support and resistance. An example of how the Fibonacci retracement can be used for technical analysis can be seen in the silver chart below, where the Fibonacci retracement is taken from two relevant points (usually a high and a low of importance).
Using the daily chart below, the Fibonacci retracement is taken from the low and high of 2020, with the 50-day moving average acting as an additional guide for price action.


