Table of contents
Part 1 - What is Technical Analysis?
Part 2 - What is Fundamental Analysis?
Part 3 - Technical Analysis for Short-Term Trades
Part 4 - Key Economic Indicators in Fundamental Analysis
Part 5 - Using Price Action in Technical Analysis
Part 6 - When to Use Technical vs. Fundamental Analysis?
When it comes to forex trading, making smart decisions is a game-changer. "Technical vs Fundamental Analysis in Forex" is a debate that many traders face, and both methods play their own unique role in helping you understand the market. Technical analysis digs into the numbers—charts, patterns, and trends—while fundamental analysis zooms out to consider the economic forces, like interest rates or global events, that shape currency value.
Picture this: technical analysis is like reading a map for quick directions, while fundamental analysis is more like understanding the road conditions ahead. Both are important, but they work best when you know when to use each.
To keep it simple, knowing how to balance both methods can make all the difference in navigating the complexities of forex. As Warren Buffett once said, “Risk comes from not knowing what you’re doing.” Let’s dive into how you can master these tools to trade smarter.
What is Technical Analysis?
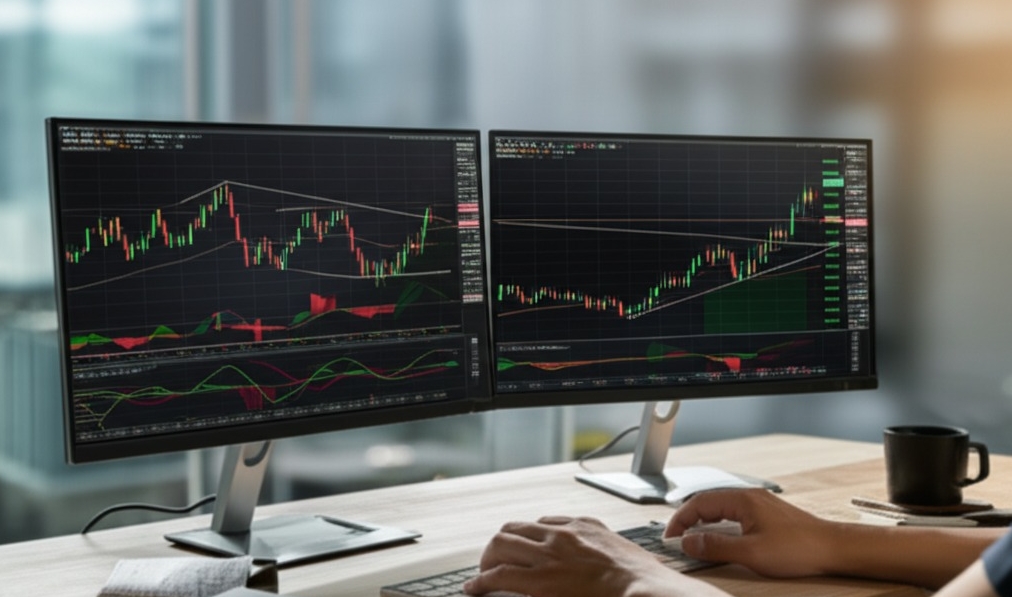
Technical analysis plays a crucial role in forex trading. It's all about analyzing price data and patterns to predict future market movements. Let’s break it down and see how it works!
Understanding Chart Patterns in Forex
Chart patterns in forex trading are like the clues in a detective story. They give you hints about the future direction of a currency pair based on past price action. Common patterns include head and shoulders, triangles, flags, and pennants. Recognizing patterns like the double top or double bottom can help you predict reversals or continuation trends. Knowing these patterns helps traders decide whether to buy or sell—key to making successful trades.
Key Tools of Technical Analysis
Technical analysis isn’t just about looking at patterns; it involves using powerful tools. Some of the most popular tools include indicators like RSI (Relative Strength Index) and MACD (Moving Average Convergence Divergence), which tell you whether a currency is overbought or oversold. Moving averages smooth out price data, and Fibonacci retracement levels help find support or resistance. Plus, there are Bollinger Bands and volume analysis to gauge volatility and market momentum. These tools help you make informed decisions.
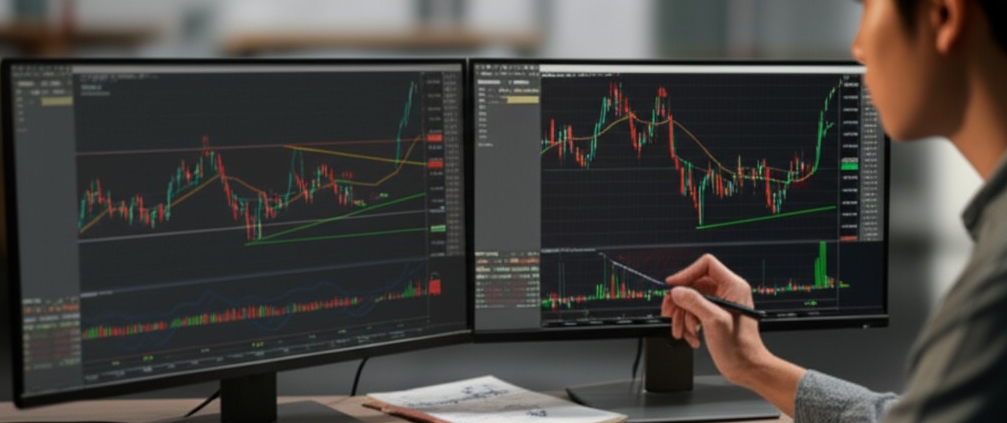
How to Read and Interpret Forex Charts
Reading forex charts is like interpreting a map—you’re looking for trends, support, and resistance. There are several chart types, such as candlestick, bar, and line charts, each offering different insights into price action. By analyzing timeframes, you can zoom in on short-term trends or take a step back to see the bigger picture. Key things to watch for are trend identification and where price bounces off support and resistance. Being able to read and interpret these charts helps you spot potential entry and exit points.
What is Fundamental Analysis?
Fundamental analysis dives into the heart of the forex market, focusing on the factors that shape currency values. It considers economic reports, political events, and social changes—everything that impacts long-term trends.

The Role of Economic Data in Forex
Economic data is the lifeblood of fundamental analysis. Key indicators like GDP growth, interest rates, and the unemployment rate provide the essential context for understanding currency movements. For example, if a country’s central bank policy raises interest rates, its currency typically strengthens. Similarly, poor consumer price index or inflation data can weaken a currency as it signals economic instability. Understanding these indicators allows traders to gauge a currency’s strength or weakness in the currency exchange market. These insights are crucial when anticipating market shifts.
Political and Social Influences on Currency Value
Politics and social conditions are often just as important as economic data when it comes to forex. Political stability and government elections can significantly shift investor perception, especially if a nation is facing geopolitical events or social unrest. For instance, trade agreements or regulatory changes can create opportunities or risks for traders. A country's sovereign debt or fiscal policy can also sway the currency's value. With such volatility in play, traders need to keep an eye on international relations and how these factors affect market sentiment and investor confidence.
Technical Analysis for Short-Term Trades
Technical analysis is a powerful tool for short-term traders looking to make quick, informed decisions. Let’s explore how key strategies can boost your short-term trading game.
The Power of Trendlines and Support/Resistance
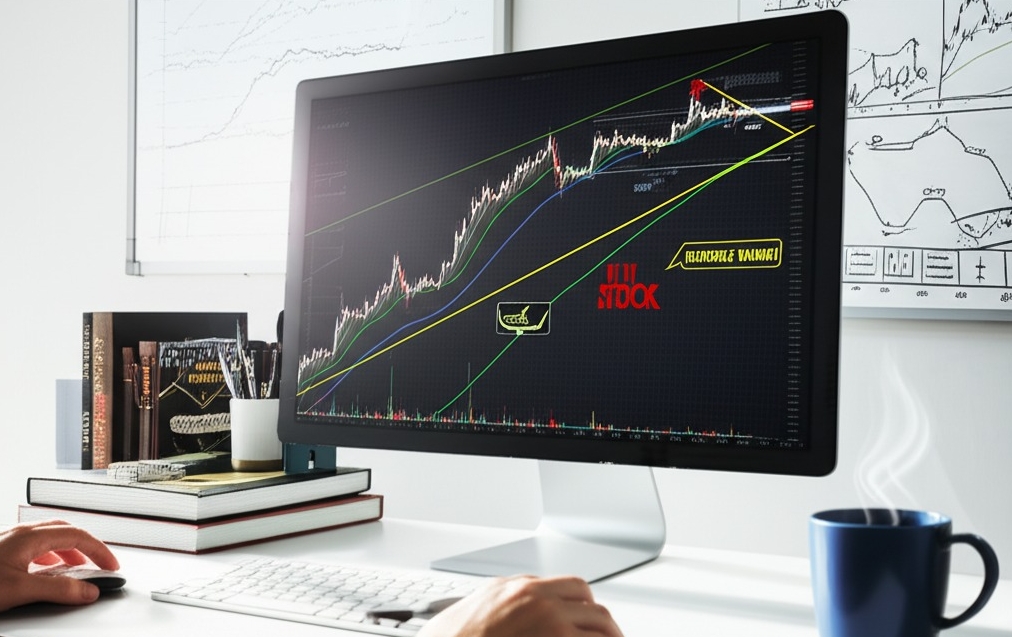
Trendlines and support/resistance levels are like the backbone of your trading strategy. A trendline helps you visualize the direction of the market, while support and resistance levels act as price barriers. If price breaks through resistance, it might signal a buying opportunity; if it falls below support, it could signal a potential drop. These key levels guide traders in identifying trends and predicting potential price movements.
Using Moving Averages for Quick Decisions
Moving averages (MAs) are technical indicators that help smooth out price action. When prices cross over a moving average, it signals a change in trend direction. For instance, a buy signal happens when a short-term MA crosses above a long-term MA, and a sell signal occurs when the reverse happens. It’s an easy way to spot shifts in the market and make decisions quickly.
Chart Patterns for Predicting Short-Term Moves
Chart patterns, like triangles or head and shoulders, give traders a heads-up on potential price action. Bullish patterns (like a double bottom) suggest upward movement, while bearish patterns (like a head and shoulders) warn of downward movement. By recognizing these patterns, traders can predict short-term market movements and act before they happen.
Risk Management in Short-Term Trading
Risk management is crucial for short-term traders who face high volatility. Implementing stop-loss orders helps limit potential losses, while position sizing ensures you’re not overexposed to any single trade. Effective risk management keeps your trading capital intact while allowing you to take advantage of profitable moves.
Key Economic Indicators in Fundamental Analysis
Understanding economic indicators is like learning to read the heartbeat of a nation. In forex, these signals can make or break your next move.

Understanding GDP Reports and Their Impact
Gross Domestic Product (GDP) is a go-to metric for measuring a country's economic health. When GDP climbs, it usually means expansion—businesses grow, jobs increase, and the national income rises. Traders look for quarterly GDP reports as economic indicators to predict currency strength.
If GDP falls short of forecasts? That can spook the market and hint at recession. Economic analysis around GDP often includes national output and spending trends.
Interest Rates: A Trader’s Best Friend
Interest rates directly influence forex by driving demand for currency. Higher interest rates tend to attract investors chasing yield, strengthening the currency.
Controlled by central banks through monetary policy
Key drivers of bond yields and forex volatility
Affect cross-border capital flows and investment decisions
As currency traders say, “Follow the rates, and the money follows you.”
Unemployment Rates and Forex Markets
Lower employment often weakens currency value.
Job reports like the U.S. Non-Farm Payrolls shake forex markets.
Rising employment boosts consumer spending and currency confidence.
When unemployment is high, it’s a red flag that the labor market is weak. This drags on economic growth and can prompt central bank policy shifts.
You see a strong labor market? That's bullish for the home currency.
Inflation Data and Currency Fluctuations
Inflation can be sneaky. When prices rise too fast, purchasing power drops—and central banks may hike interest rates to slow it down.
Traders watch CPI and PPI reports like hawks:
CPI (Consumer Price Index): Tracks what consumers pay
PPI (Producer Price Index): Reflects cost trends from suppliers
Volatility Tip: High inflation often triggers big swings in currency pairs
“Inflation is the mother of all market moves,” says Kathy Lien, Managing Director at BK Asset Management.
The Role of Central Banks in Forex
Central banks aren’t just behind the curtain—they’re the ones pulling strings. Their actions ripple across the forex market.
| Central Bank | Main Tool | Forex Impact |
|---|---|---|
| Federal Reserve | Interest Rates | USD strength/weakness |
| ECB | Quantitative Easing | EUR liquidity effects |
| BoJ | Currency Intervention | Yen volatility |
From interest rate decisions to currency stability efforts, their every move sends signals traders must decode.
Using Price Action in Technical Analysis
Price action trading strips things down to the raw data—just price and time. No indicators, no clutter—just you, the chart, and the story the market’s telling.
What is Price Action Trading?
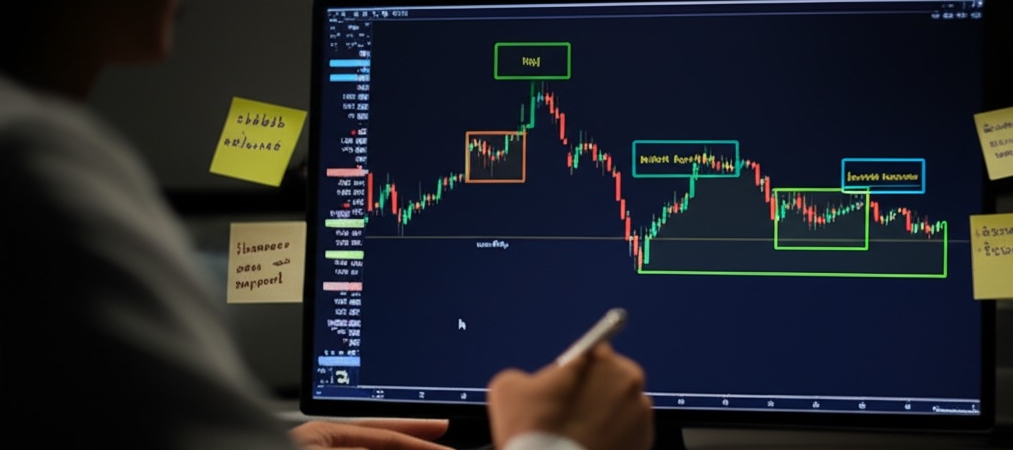
Price action trading is all about analyzing the movement of prices over time—no indicators, no fuss. You’re reading the market like a book, using patterns, volume, and raw price behavior to anticipate what’s coming next.
This strategy leans on real-time chart observations and trader intuition. Think of it as street-smart trading: reading what the market's whispering instead of what the textbook says.
Focuses on trends, key support/resistance levels, and volume
Traders often use tools like trendlines and pin bars
It’s heavily reliant on practice, pattern recognition, and quick thinking
Interpreting Candlestick Patterns for Decisions
Candlestick patterns act like traffic signals in trading—they tell you when to go, slow down, or stop. Some signal reversals, others trend continuation. The trick is knowing which one's speaking and when.
Bullish Engulfing: Strong sign buyers are taking over
Bearish Harami: Warning that a downtrend might kick in
Doji Candle: Market indecision—standby mode
Hammer & Shooting Star: Reversal alerts near price extremes
“Price action tells you everything—if you listen closely,” says Al Brooks, a top price action trader. Learning to read candlesticks gives you a head start on smart entries and exits.
| Pattern | Type | Signal Strength (1-10) |
|---|---|---|
| Bullish Engulfing | Reversal | 8 |
| Doji | Indecision | 5 |
| Hammer | Reversal | 7 |
| Bearish Harami | Reversal | 6 |
When to Use Technical vs. Fundamental Analysis?

Forex trader Marcus Allen, with over a decade on Wall Street, once shared, “Your strategy is only as good as your timing—and knowing what tool to use when is half the battle.” That truth hits home for anyone navigating the chaos of currency markets.
Use technical analysis when chart patterns speak louder than headlines. Short-term trading? Volatility is your dance floor, and technical indicators are your rhythm. Think RSI, MACD, moving averages—tools made for reading quick market shifts. Traders managing intraday positions often ignore the news feed, instead watching candlestick shapes and price action setups.
On the flip side, fundamental analysis shines during economic data releases or geopolitical shake-ups. Long-term investing strategies often rely on interpreting interest rate decisions, GDP reports, and central bank statements. When the Federal Reserve moves, the markets move—no chart can predict that like data-driven insight can.
Your time horizon: minutes vs. months
Your trading strategy: reactionary vs. predictive
The market conditions: calm vs. chaos
The impact of news events: noise or signal?
“Charts tell you how it’s happening,” Marcus added. “The news tells you why it’s happening.” Knowing when to lean on each is not optional—it is essential.
Which Analysis Method is Best for Traders?
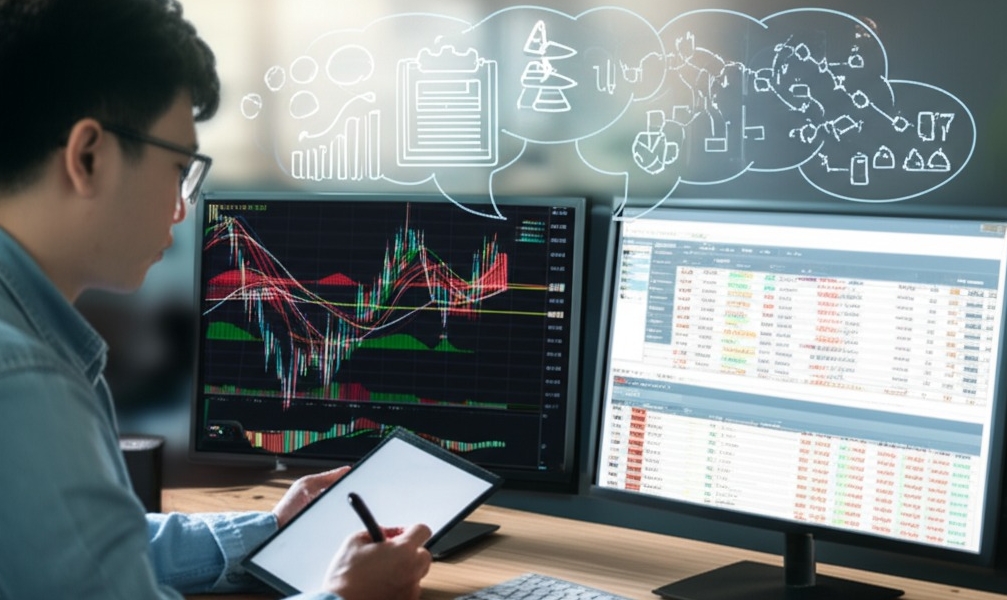
Finding your trading edge starts by knowing what works best for you—and when.
Pros and Cons of Technical Analysis
Technical analysis gives traders a real-time pulse of the market. It’s visual, immediate, and great for spotting quick wins.
Pros:
Uses charts, patterns, and indicators to make decisions fast
Helps with market timing and entry/exit points
Based on price action, no need to follow financial news
Cons:
Relies heavily on historical data, not future events
Can be misleading in volatile news-driven markets
False signals are common without confirmation
"Charts show what the market’s thinking—sometimes louder than the headlines."
Strengths and Weaknesses of Fundamental Analysis
Fundamental analysis is your go-to when you’re playing the long game. It’s all about digging into the "why" behind price movements.
Strengths:
Evaluates intrinsic value and company performance
Driven by economic data, industry trends, and financials
Better suited for long-term investment decisions
Weaknesses:
Less helpful for short-term market timing
Depends on accurate forecasting of news and events
Can be time-consuming without real-time signals
"Warren Buffett built an empire on understanding the fundamentals."
Combining Both for a Balanced Approach
Here’s the deal: smart traders don’t pick sides—they blend both strategies. You might spot a trend on a chart, then check if economic data backs it up.
Use technical analysis for timing, and fundamental analysis for confirmation
Create a holistic view to avoid tunnel vision
Boost your risk management by filtering out low-quality trades
Develop a combined strategy that adapts to market changes
“It’s not this or that—it’s both. That’s how you trade smart.” — Kathy Lien, Forex Analyst
Choosing the Right Method Based on Your Trading Style
| Trading Style | Time Commitment | Best Suited Analysis |
|---|---|---|
| Day Trading | High | Technical Analysis |
| Swing Trading | Moderate | Both Methods |
| Long-Term Investing | Low-to-Moderate | Fundamental Analysis |
If you love charts and fast moves, go technical
If you prefer deep dives and patience, go fundamental
Want the best of both worlds? Mix and match to fit your strategy alignment and risk tolerance
Combining Both Analyses for Success
Blending technical and fundamental analysis in forex trading isn’t just smart—it’s the edge many pros use to stay ahead. Let’s break down how to do it right.
Integrating Technical and Fundamental Strategies
Want a bigger picture of the market? Mixing technical analysis with fundamental insights can offer that sweet spot between precision and perspective.
Use technical indicators like RSI or MACD for timing entries.
Pair them with economic data such as NFPs or interest rate decisions to understand momentum drivers.
Chart patterns show “how”; news events reveal the “why.”
This combo helps traders avoid emotional trades and base decisions on layered evidence.
"A hybrid strategy gives you the story and the signal," says Kathy Lien, Managing Director at BK Asset Management.

Real-Life Examples of Combined Analysis
These real forex trading examples show how dual analysis makes a difference:
| Trade Scenario | Technical Signal | Fundamental Trigger |
|---|---|---|
| EUR/USD Breakout | Ascending triangle | ECB press conference |
| USD/JPY Reversal | Bearish divergence | BoJ policy announcement |
| GBP/USD Long Entry | Moving average cross | Positive UK employment data |
Case studies like these highlight that when both methods align, trade execution becomes more confident and lower risk. Traders use historical data to spot patterns where indicators and macro events converge—turning good trades into great ones.
Practical Steps to Implement a Hybrid Approach
Choose a trading style – Day trader? Swing trader? Match your strategy.
Create a trading plan – Include both chart analysis and economic event monitoring.
Backtest your hybrid strategy using at least 6 months of historical data.
Set risk parameters – Use stop-loss levels that consider both trend lines and volatility from upcoming news.
Monitor trades – Adjust based on new data releases and technical movement.
Use a solid trading platform like MetaTrader or TradingView for seamless execution and analysis.
When you mix smarts with strategy, forex becomes less of a gamble and more of a calculated game.
Conclusion
At the end of the day, trading isn’t about picking sides—it’s about finding what clicks. Technical vs Fundamental Analysis in Forex isn’t a battle; it’s more like picking the right tool for the job. Some traders ride the waves of chart patterns, others lean into global news and economic vibes.
As John Maynard Keynes said, “Markets can remain irrational longer than you can remain solvent.” Smart traders learn to ride both sides of the fence.
Test both waters. Blend what works. That’s how you stop guessing—and start trading with purpose.
Candlestick patterns are visual cues on a price chart that tell a story about market sentiment. Each candlestick shows the open, high, low, and close of a specific time period—helping traders predict future price movement based on how the market has behaved.
Interest rates influence the demand for a currency. When a country's interest rate goes up, its currency tends to strengthen because investors want the higher returns. Lower rates usually lead to weaker demand. Traders watch central bank decisions like hawks for this reason.
Moving Averages (MA) – Smooths out price data over time.
Relative Strength Index (RSI) – Tells if a currency is overbought or oversold.
MACD – Great for spotting momentum shifts.
Bollinger Bands – Helps visualize volatility and possible reversals.
Absolutely. Many successful traders mix both to get the full picture:
Use fundamentals to understand long-term trends (e.g., interest rate hikes).
Use technicals to fine-tune your entry and exit points.
Think of it like using a GPS and checking traffic before you hit the road.
Price action is the study of raw price movement—no indicators, no fluff. It’s all about interpreting market behavior through patterns and candlesticks. Traders who use price action believe the market "speaks for itself," and prefer to trade based on what price is doing in the moment.
Not always, but they’re essential. News releases like GDP or inflation reports can cause sharp moves. That said:
The market might already price in expected news.
Surprises (good or bad) tend to move prices more than expected results.
Context matters—a weak jobs report during a global crisis hits harder.
That really depends on how deep you go. Most traders start grasping the basics in a few weeks, but mastering it? That’s months, maybe years. Like any skill, consistency matters more than cramming. Think of it like learning a sport—you won’t win tournaments right away, but you’ll improve if you show up and practice.
Lagging indicators confirm trends after they’ve started.
Leading indicators try to predict where price might go next.
Lagging is safer but slower; leading is faster but riskier.
Many traders use both to balance timing and confirmation.


