GOLD TRADING TIPS
Few markets on Earth have the historical appeal and attraction as Gold. While traders have numerous trading options today, in a number of different currencies or asset classes or geographies, Gold has been a long-standing store of value that’s piqued speculators’ interest for about as long as human beings have traded with each other.
We previously looked at some of the basics around Gold trading in the What is Gold article a little earlier in this sub-module. And we also have a ‘How to Trade Gold’ article on the Gold page of DailyFX. But, in this article, we’re going to get a bit more granular as we investigate Gold Trading Strategies, Tips and Tactics.
Gold Trading Tips
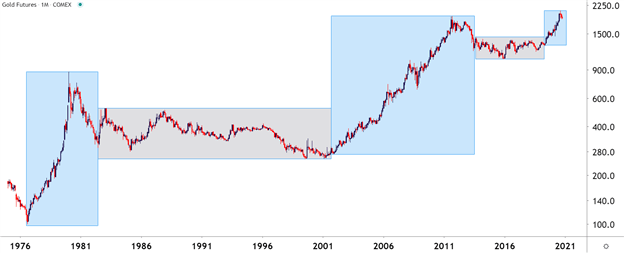
Probably one of the more obvious aspects of Gold, particularly on a longer-term basis, is the cycle sensitivity that will often show around the metal – and this isn’t a new phenomenon. As markets themselves are cyclical animals, Gold often moves to a similar type of tune, although timing may be differentiated from other markets at the time. Looking at Gold prices over the past 45 years, and this becomes a bit more clear. On the below chart, trends and ranges have been identified by blue or grey boxes, and that leads us into tip number one:

RECOMMENDED BY JAMES STANLEY
Download our most recent Gold Forecast
Get My Guide
GOLD TRADING TIP #1: ADAPT TO THE PRESENT CONDITION
The key takeaway here is the importance of adaptation: Because if a trend trader approaches Gold with their typical approach while Gold markets are in a range, there’s high odds they could see unfavorable results. If Gold markets are mean-reverting and range-bound, the trader would likely want to approach the matter with a range-based approach. But, when Gold markets are trending, such as the case from 2001-2011 or 1976-1980, then traders are going to want to utilize trend strategies to adapt to the present condition.
Gold Futures Monthly Chart

Chart prepared by James Stanley; Gold on Tradingview
GOLD TRADING TIP #2: WATCH THE US DOLLAR
The US Dollar is traded in a number of markets but, in the largest venues, Gold is traded in US Dollars. As a matter of fact, one common equation on CFD platforms presents a quote for Gold prices as ‘XAU/USD.’ The chemical symbol for Gold on the periodic table of elements is ‘AU’ and the denominator in that quote is the US Dollar, highlighting how Gold is being priced in terms of US Dollars.
This also means that, all factors held equal, and if Gold made no move at all but the US Dollar increased in value – the price of Gold could go down. Because in the function above, the value of the denominator, or USD, would increase in value thereby decreasing the value of the function as a whole.
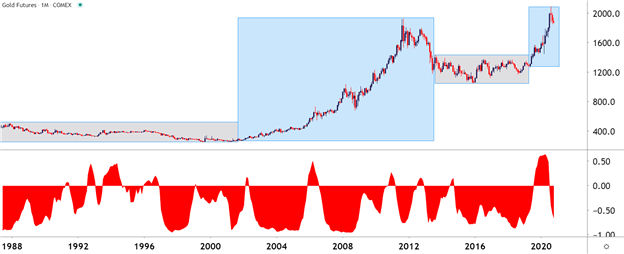
So, there could be a tendency for Gold to display an inverse correlation with the US Dollar. This isn’t all of the time, there are scenarios where both Gold and the Dollar may increase in value although those are somewhat rare, historically speaking.
On the below chart, that correlation is highlighted in the bottom portion of the image. Reads or values above the zero line indicate positive correlation which, again, is somewhat rare but not unheard of. Reads below zero highlight inverse correlation, with a value of -1 highlighting a perfect inverse relationship.

RECOMMENDED BY JAMES STANLEY
Access our most recent US Dollar Forecast
Get My Guide
Gold Monthly Price Chart: An Inverse Relationship with the US Dollar

Chart prepared by James Stanley; Gold on Tradingview
GOLD TRADING TIP #3: KNOW YOUR TIME FRAMES
On the above charts we’re looking at the bigger picture behind Gold prices using the Monthly variety. But these conditions and market changes can take place on shorter-terms, as well, and it’s key for traders to have some type of consistent framework for their analysis so that they can properly implement their strategies in the ways that they want.
As we looked at in the multiple time frames article, traders should analyze markets from more than a single vantage point. The above monthly variety can be helpful to see the bigger picture – but for actually setting up trades and implementing strategies, traders will likely want to look to shorter time frames.
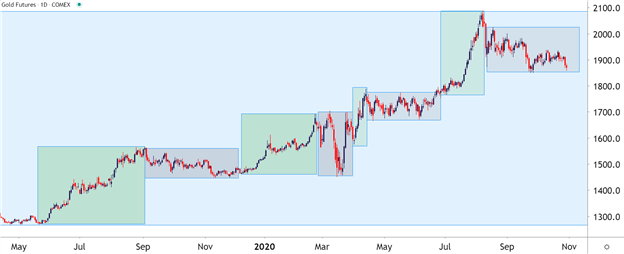
In the above graphic, the blue box on the right side of the chart shows a trend that’s been going for a little over two years now. But, looking at the shorter-term daily chart below to get a more granular look at that two-year-outlay shows that Gold prices were not trending the entire time. As a matter of fact, the same type of trend-range-trend-range relationship presented itself inside of this longer-term trend.
This is again important for traders when setting up strategy because for those that are looking to trade a trend, waiting for the monthly chart to highlight that potential may be too late. On the below chart, that blue box has been expanded so we can take a more granular look at the trend; but this time, I’ve added green boxes around the shorter-term trends and grey boxes around the mean-reverting or range-bound periods.
Gold Daily Price Chart

Chart prepared by James Stanley; Gold on Tradingview
GOLD TRADING STRATEGIES
Perhaps more important than the specific strategy that one is using to analyze or set up trades in Gold is the ‘fit’ to that specific market condition. For instance, if we look at the above image and focus on the green boxes, when the short-term trend is moving in the direction of the longer-term trend, traders are going to want to follow the age-old adage of ‘buying low and selling high.’ In the grey portions, however, when prices are ranging, traders want to similarly buy low and sell high but they’re going to want to do that in a slightly different way; closing the entirety of the long position while ‘high’ and then looking at potentially getting short to play the other side of the range.
Right up front – this means that no trader is always going to be ‘right’ because conditions, similar to trends, will change; and its impossible to know that until after the fact. This is where items like trade and risk management come into play, potentially helping to mitigate the downside in those instances where something changes or shifts away from their expectations.
Simplifying Market Behaviors by Assigning ‘Conditions’
With any market, if you think about it, there’s really only a couple of things that prices might do: Trend or not. Either prices are trending in a directional move for some reason, or they’re not trending at all: And the transitory state between mean-reversion and trends are breakouts, which are technically a market condition, itself. So, in that effort of simplification, analysts can break down market conditions into three specific types:
Trend – a directional move is showing and there’s often a fundamental reason for it as traders are bidding higher-highs and higher-lows (or selling lower-lows and lower-highs).
Range/Mean-Reversion – devoid of a driver, prices will often display no trend, which can open the door for range-bound or mean-reversion strategies.
Breakouts – this is what happens when new information gets priced-in, and this can create a breakout move from a range and into a new trend. That new trend may last for a while or it may merely propel price action into a new range.
Bespoke Approach for the Proper Condition
Knowing what state a market is in isn’t enough, as traders are usually going to want to cater their approach to that specific condition. For instance, a trader focusing on breakouts likely won’t be able to withstand as much excursion as a trader picking on range/mean reversion setups.
At DailyFX, we help traders learn more about strategies for each of these conditions. But, perhaps the most important aspect of customizing a strategy to a specific traders’ needs is the risk management component, which is explored in-depth our Traits of Successful Traders research series, which is available completely free-of-charge and can be accessed by clicking on the link below:


