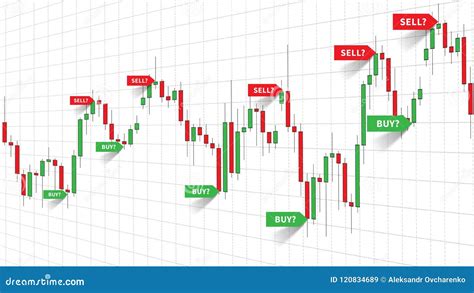
Forex trading has become an increasingly popular way for individuals to engage with the global financial markets. At the heart of successful trading lies the use of Forex trading signals, which provide essential insights and recommendations to guide traders in making informed decisions. These signals, whether generated manually or through automated systems, offer real-time market data, trends, and predictions that can significantly enhance a trader’s ability to navigate the complex world of currency markets. By understanding how to interpret and apply these signals, traders can improve their strategies and increase the likelihood of successful trades. In this guide, we'll explore the different types of Forex trading signals, how to effectively use them, and the tools and techniques that can support your trading decisions.
1.jpg

Understanding Forex Trading Signals

In Forex trading, Forex Trading Signals are crucial for guiding traders to make informed decisions. These signals are based on various factors such as currency pair movements, technical indicators, and market events, and help traders maximize profits while minimizing risks.

What are Forex Trading Signals?

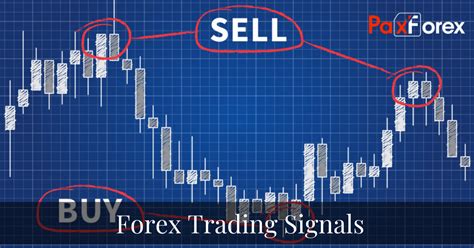
Forex trading signals are market alerts that provide insights on when to buy or sell a currency pair. These signals are derived from technical analysis, often combined with economic indicators, and are designed to help traders make precise decisions in the fast-moving Forex market.

  1. Origin: Signals typically come from either automated systems or manual analyses by experienced traders.

  2. Purpose: They help in identifying optimal entry and exit points for trades, aiming to capitalize on market movements.

  3. Sources:

    • Automated signals: Generated by software tools or algorithms that analyze the market data in real-time.

    • Manual signals: Provided by expert traders who analyze charts, patterns, and news to predict market behavior.

These signals can be for any major currency pair like EURUSD, GBPUSD, or USDJPY and are often accompanied by suggested stop loss and take profit levels for effective risk management.

Types of Forex Trading Signals: Automated vs. Manual Signals

Forex signals can be broadly classified into two categories: automated and manual. Each has its unique features and benefits.

  • Automated Forex Signals:

    • Generated by algorithms or AI-based trading systems.

    • Provide real-time alerts based on pre-defined parameters.

    • Often used by traders who prefer hands-off trading.

  • Manual Forex Signals:

    • Created by human traders analyzing charts, indicators, and economic events.

    • Offers more personalized insights and nuanced analysis.

    • Relies on the expertise and experience of the signal provider.

Key Differences:

  1. Speed: Automated signals react instantly to market changes; manual signals take more time to analyze.

  2. Accuracy: Automated systems are programmed to follow strict parameters, but manual signals can adjust based on market sentiment and nuances.

How Forex Trading Signals Help Traders Make Informed Decisions

Forex trading signals are essential tools for traders to optimize their decision-making process. Here’s how they contribute to more informed trading:

  • Signal Validation: Helps traders validate their market predictions with technical data, such as RSI or MACD.

  • Risk Management: Signals often come with recommended stop loss and take profit levels, aiding in controlled risk exposure.

  • Market Timing: Identifies the perfect entry or exit points, improving timing and reducing the risk of missing profitable moves.

  • Simplifies Strategy: Provides clarity in decision-making, especially when combined with solid trading strategies like scalping or trend following.

2.jpg

How to Interpret Forex Signals

Interpreting Forex signals involves understanding not just the information they provide but also how it fits into a broader trading strategy. When receiving a Forex signal, traders must first look at the currency pair involved and the suggested trade direction. For example, a signal suggesting to buy EURUSD means that the system or signal provider expects the Euro to rise against the US Dollar.

Next, traders must verify the signal's validity by cross-checking it with their preferred trading indicators, such as Bollinger Bands or Fibonacci retracements, to ensure that it aligns with the overall market sentiment. Once validated, a trader can enter the trade while setting appropriate risk/reward ratios.

  • Understanding Candlestick Patterns: Often, signals include or are based on key chart patterns like Head and Shoulders or Double Bottom. Recognizing these patterns adds an extra layer of confidence to the signal.

  • Using Timeframes: Traders should match signals with the appropriate timeframes (e.g., H1, D1) to gauge the market's current trend and volatility.

Best Practices for Using Forex Signals

To make the most out of Forex trading signals, here are some best practices:

Step 1: Choose a Reliable Source

  • Look for proven signal providers with a history of accuracy.

  • Consider using automated signal systems that are based on robust algorithms or trusted manual providers.

Step 2: Combine Signals with Personal Analysis

  • Use RSI, MACD, or other indicators to confirm signals.

  • Don’t rely solely on the signals; always incorporate your own technical analysis.

Step 3: Apply Risk Management Strategies

  • Ensure that every trade includes a stop loss and take profit to safeguard against unexpected market fluctuations.

Step 4: Track and Adjust

  • Continuously evaluate the performance of the signals you’re using.

  • Adjust your trading strategy based on the changing market conditions.

Forex Trading Signal Example for EURUSD

Currency PairActionEntry PointStop LossTake ProfitSignal TypeIndicators Used
EURUSDBuy1.12001.11501.1300AutomatedRSI, MACD
GBPUSDSell1.31001.32001.3000ManualFibonacci, MACD
USDJPYBuy112.50112.00113.00AutomatedBollinger Bands


Popular Currency Pairs & Their Trading Signals

In Forex trading, understanding popular currency pairs and the signals associated with them is crucial for making informed decisions. This cluster will focus on key pairs such as EUR/USD, GBP/USD, and others, along with how trading signals can be applied to them.

1. EUR/USD: The Most Traded Currency Pair

The format is a list.

  • Liquidity and Popularity: EUR/USD is the most liquid and widely traded currency pair in the world, offering tight spreads and low volatility, ideal for short-term trades.

  • Trading Signals for EUR/USD:

    • RSI and MACD: These indicators help identify overbought or oversold conditions for EUR/USD, signaling potential reversal points.

    • Bollinger Bands: When EUR/USD touches the outer bands, it signals an overextended market, which may precede a reversal or correction.

    • Support and Resistance Levels: Key price levels often act as signals for potential breakout or reversal trades.

2. GBP/USD: Capitalizing on Volatility

GBP/USD, often referred to as "Cable," is known for its high volatility compared to other major currency pairs. The pair responds dramatically to geopolitical news, interest rate changes, and market sentiment surrounding the British Pound and the US Dollar. When using trading signals for GBP/USD, traders often rely on momentum indicators such as Stochastic RSI and Moving Averages to capture rapid price movements.

For example, if the Stochastic RSI enters overbought or oversold territory, it indicates that the price might soon reverse or pull back. Furthermore, the Fibonacci Retracement levels are frequently used to identify potential price retracements after significant trends.

GBP/USD’s volatility can be both an advantage and a challenge, so it’s essential to use proper risk management and stop-loss strategies to minimize the impact of rapid price fluctuations.

3. USD/JPY: Analyzing Technical Signals

  1. Market Behavior: USD/JPY is known for being influenced by interest rate differentials between the US and Japan. Changes in these rates can create strong trading signals.

  2. Key Indicators: The Ichimoku Cloud can be highly effective for USD/JPY, helping traders identify trends, support/resistance, and entry points.

  3. Chart Patterns: For USD/JPY, common chart patterns like Head and Shoulders or Double Tops often provide signals for potential reversals.

  4. Economic Events Impact: Events like the US Non-Farm Payroll or Bank of Japan interest rate decisions significantly impact USD/JPY’s price action, offering key trading signals.

4. AUD/USD and Other Cross-Pairs

Currency PairCharacteristicsIdeal TimeframeTrading Signals
AUD/USDHighly correlated with commodity prices, especially gold.H1, H4Use MACD for momentum, Bollinger Bands for price extremes.
EUR/GBPSensitive to economic data from both Eurozone and UK.M30, H1RSI to determine overbought/oversold conditions.
USD/CHFOften a safe-haven currency in times of market uncertainty.M15, H1Fibonacci Retracement for potential entry points during trends.
NZD/USDInfluenced by global commodity prices, similar to AUD/USD.M30, H4Use Stochastic RSI for overbought/oversold signals.

Understanding how Forex trading signals interact with popular currency pairs like EUR/USD, GBP/USD, and USD/JPY is essential for crafting effective strategies. By combining technical indicators and economic insights, traders can use signals to make informed trading decisions. These pairs, along with others such as AUD/USD and NZD/USD, offer unique opportunities and risks, requiring careful analysis and management to capitalize on their price movements.

3.jpg

Forex Trading Indicators and Signals

Forex Trading Indicators are essential tools that help traders confirm, filter, and refine trading signals. In this article, we will explore how different indicators, including MACD, RSI, and Fibonacci, interact with Forex trading signals to enhance market analysis and decision-making.

1. MACD and its Role in Trading Signals

The MACD (Moving Average Convergence Divergence) is a trend-following momentum indicator used to spot changes in the strength, direction, momentum, and duration of a trend. Here's how it interacts with trading signals:

  • Signal Line Crossovers: When the MACD line crosses above the signal line, it suggests a buying signal. Conversely, when the MACD line crosses below, it signals a potential sell.

  • Divergence: Divergence between MACD and price action (e.g., price making new highs while MACD fails to do so) can indicate weakening momentum, signaling caution or a potential reversal.

  • Histogram Analysis: The histogram visually represents the distance between the MACD and its signal line. The larger the histogram, the stronger the trend, adding further clarity to Forex trading signals.

2. RSI: Understanding Overbought and Oversold Conditions

The RSI (Relative Strength Index) is a momentum oscillator used to measure the speed and change of price movements. It helps to identify whether a currency pair is overbought or oversold.

  • Overbought Conditions: RSI values above 70 indicate that a currency pair may be overbought and could be due for a pullback or reversal.

  • Oversold Conditions: RSI values below 30 suggest that the currency pair may be oversold, signaling a potential buying opportunity.

  • Divergence with Price: When RSI diverges from the price action (e.g., price continues to make lower lows while RSI makes higher lows), it may signal an upcoming reversal, aligning with trading signals.

3. Using Bollinger Bands to Validate Trading Signals

(This section includes a table for better clarity)

Bollinger Bands are a volatility indicator that uses a simple moving average (SMA) and two standard deviation bands to create upper and lower bands around price. These bands expand and contract based on volatility.

Here’s how you can use Bollinger Bands alongside Forex trading signals:

Market ConditionActionSignal Confirmation
Price Touches Upper BandIndicates overbought conditions.Consider a sell signal when other indicators confirm.
Price Touches Lower BandIndicates oversold conditions.Consider a buy signal if supported by other signals.
Band SqueezeTight bands suggest low volatility, signaling a potential breakout.Look for a breakout when the price moves beyond the bands.
Band ExpansionExpanding bands show increasing volatility.Use this as confirmation of a strong trend continuation signal.

By pairing Bollinger Bands with other indicators like RSI or MACD, traders can validate and strengthen their trading signals.

4. Stochastic RSI for Timing Entries and Exits

The Stochastic RSI (StochRSI) is an oscillator of an oscillator. It is used to determine overbought and oversold conditions more sensitively than the regular RSI. Here's how it works:

  • Overbought and Oversold Zones: When the StochRSI exceeds 0.8, it indicates overbought conditions, while values below 0.2 signify oversold conditions.

  • Signal Crossovers: When the StochRSI crosses above the 0.2 level from below, it can trigger a buy signal. Conversely, crossing below 0.8 from above suggests a sell signal.

  • Sensitivity: Due to its sensitivity, the Stochastic RSI provides earlier signals than traditional RSI, making it a great tool for confirming Forex trading signals.

5. Fibonacci Retracement: Identifying Market Corrections

Fibonacci Retracement levels are popular among traders for identifying potential reversal levels in the market. These levels are based on key Fibonacci ratios—23.6%, 38.2%, 50%, 61.8%, and 100%.

  • Common Reversal Levels: Traders often look for price reversals at these Fibonacci levels after a significant price movement, which could confirm buy or sell signals.

  • Confluence with Other Indicators: The effectiveness of Fibonacci retracement levels increases when they coincide with other technical signals (e.g., RSI or MACD) or support and resistance zones.

By incorporating Fibonacci into trading signal analysis, traders can better predict where price corrections may occur and adjust their entries or exits accordingly.

6. Ichimoku Cloud: An Advanced Indicator for Signal Confirmation

The Ichimoku Cloud is an all-in-one indicator that provides information about support, resistance, trend direction, momentum, and market equilibrium. Here's how it confirms trading signals:

  • Cloud Formation: When the price is above the cloud, it indicates a bullish trend, while a price below the cloud signals a bearish trend.

  • Tenkan-Sen and Kijun-Sen Crossovers: The fast-moving Tenkan-Sen and slow-moving Kijun-Sen lines crossing each other can signal potential buy or sell opportunities.

  • Chikou Span: The Chikou Span is used to confirm the trend. When it’s above the price, the trend is bullish, and when below, it is bearish.

Using Ichimoku Cloud in conjunction with other indicators enhances the reliability of Forex trading signals by providing a comprehensive view of market trends and potential reversals.


we have explored essential Forex trading indicators and their interactions with trading signals. From the MACD and RSI to advanced tools like Ichimoku Cloud and Fibonacci Retracement, each of these indicators plays a critical role in confirming or refining signals. By using these tools in combination, traders can improve their market predictions and enhance their overall strategy.


Risk Management Strategies in Forex Trading

In Forex trading, risk management is vital to long-term success. By effectively managing risk, traders can protect their capital and avoid significant losses. This cluster focuses on how to incorporate sound risk management strategies when using Forex Trading Signals, including stop losses, take profits, and position sizing to ensure sustainable trading.

1: Stop Loss and Take Profit: Protecting Your Trades

Stop Loss and Take Profit orders are crucial tools for protecting your trades and locking in profits. By using these orders strategically, traders can limit their exposure to market volatility and ensure their trading plan remains intact.

  • Stop Loss:

    • Automatically closes a trade if the price moves against you by a certain amount.

    • Helps prevent large losses during periods of high market volatility.

    • Customizable based on risk tolerance.

  • Take Profit:

    • Automatically closes a trade when a certain profit target is reached.

    • Ensures that profits are taken at the desired level, avoiding emotional decision-making.

    • Important for trading in volatile markets to secure profits before reversals occur.

These two tools work together to establish clear entry and exit points for a trade. They help maintain discipline and prevent excessive risk-taking, making them essential for Forex traders.

2: Risk/Reward Ratio and Position Sizing

When using Forex Trading Signals, understanding the Risk/Reward Ratio and Position Sizing is key to protecting your capital while maximizing profits. Here’s why:

  1. Risk/Reward Ratio:

    • This ratio compares the potential risk of a trade to its potential reward.

    • A commonly used ideal ratio is 1:3, meaning you risk $1 to make $3.

    • Helps traders set realistic profit targets while maintaining a balanced risk exposure.

  2. Position Sizing:

    • Refers to the amount of capital allocated to each trade.

    • Position sizing is crucial in controlling the total amount of risk taken on any given trade.

    • Formula for calculating position size:
      Position Size=Account Equity×Risk PercentageStop Loss in Pips×Pip Value\text{Position Size} = \frac{\text{Account Equity} \times \text{Risk Percentage}}{\text{Stop Loss in Pips} \times \text{Pip Value}}

3: Money Management Tips for Consistent Profitability

Effective Money Management strategies are vital for consistent profitability in Forex trading. It’s not just about having good signals, but how you manage your trades financially.

  1. Risk Per Trade:

    • Limit your risk per trade to a small percentage of your account balance (typically 1-2%).

    • This helps avoid large drawdowns that can affect long-term profitability.

  2. Diversification:

    • Avoid putting all your funds into one trade. Diversify across multiple currency pairs and strategies.

    • This spreads risk and helps smooth out performance over time.

  3. Review and Adjust:

    • Continuously evaluate your trading performance and adjust your strategies accordingly.

    • Regularly assess your risk management and position sizing to ensure they align with your trading goals.

Position Sizing Calculation Example

Account EquityRisk PercentageStop Loss (pips)Pip ValuePosition Size CalculationPosition Size (Units)
$10,0002%50$0.10(10,000 * 0.02) / (50 * 0.10)40 units
$15,0001%30$0.15(15,000 * 0.01) / (30 * 0.15)33 units
$20,0001.5%40$0.12(20,000 * 0.015) / (40 * 0.12)62 units

Economic Events & Their Impact on Forex Signals

Economic events significantly influence Forex market trends and trading signals. Events such as Non-Farm Payrolls, interest rate decisions, and GDP reports can cause currency fluctuations, directly impacting trading strategies. Understanding these events helps traders use signals effectively.

1: Understanding Non-Farm Payroll Reports and Their Impact

  • What are Non-Farm Payrolls (NFP)?
    NFP measures the number of jobs added to the U.S. economy, excluding farming-related jobs, government workers, and non-profit employees.

  • Impact on Forex Signals
    NFP results are crucial because they provide insight into the U.S. economy’s health. Strong job growth can lead to a stronger USD, while poor reports can weaken it, affecting trading signals, especially for pairs like EURUSD and GBPUSD.

  • Market Reactions to NFP

    • USD appreciation: If NFP data shows strong growth, traders might expect a rate hike by the Federal Reserve.

    • USD depreciation: Weak NFP results may lead to a decrease in interest rate expectations, weakening the USD.

2: Interest Rate Decisions: How They Affect Signals

Interest rate decisions by central banks such as the Federal Reserve or the European Central Bank are pivotal in Forex markets. These decisions often trigger volatility and shifts in currency value.

  • Interest Rate Hikes

    • When the Federal Reserve raises interest rates, the USD typically strengthens as investors seek higher returns.

    • Interest rate hikes generally trigger stronger USDJPY signals as traders anticipate capital flows into the U.S. market.

  • Interest Rate Cuts

    • Conversely, a rate cut signals a weaker currency. Traders might expect a weaker EURUSD if the European Central Bank cuts rates.

Understanding how interest rate decisions correlate with Forex signals is key for positioning trades around such events.

3: Inflation and GDP Data: Key Economic Indicators

Economic indicators such as inflation data and GDP growth reports help traders evaluate the economic health of a country. These indicators influence currency strength, shaping Forex signals.

  • Inflation Rate Impact

    • High inflation generally weakens the currency (e.g., USDCHF may fall), signaling potential rate hikes.

    • Low inflation often results in lower interest rates, creating negative signals for the currency.

  • GDP Growth Impact

    • Strong GDP growth typically strengthens the national currency, producing positive signals for pairs like USDJPY and AUDUSD.

    • Weak GDP growth might signal economic slowdowns, weakening the EURUSD.

4: Central Bank Meetings and Forex Market Reactions

Central banks hold regular meetings to discuss monetary policy, which directly affects the Forex market. These meetings can alter interest rate expectations and influence Forex signals.

Central BankExpected Policy ActionCurrency ImpactPotential Pairs Affected
Federal Reserve (USA)Interest rate hikeUSD strengthEURUSD, USDJPY
European Central BankInterest rate cutEUR weaknessEURUSD, EURGBP
Bank of JapanMaintain current ratesJPY weaknessUSDJPY, EURJPY
Bank of CanadaHike ratesCAD strengthUSDCAD, EURCAD


Conclusion

In conclusion, Forex trading signals are a vital tool for any trader looking to gain an edge in the volatile currency markets. By understanding the various types of signals, the currency pairs most commonly traded, and the technical indicators that can refine these signals, traders can better navigate the complexities of Forex trading. Additionally, effective risk management strategies are critical to safeguarding profits and ensuring consistent long-term success. Economic events and their effects on Forex signals further highlight the importance of staying informed and adaptable.


What are Forex Trading Signals?
  • Forex trading signals are indicators that suggest when to buy or sell a particular currency pair in the Forex market. They are typically based on technical analysis, fundamental analysis, or a combination of both.

    • They help traders identify entry and exit points for trades.

    • Signals can come from automated tools or manual analysis by experts.

    • Traders use these signals to make informed decisions, reducing the risk of emotional trading.

How do I use Forex Trading Signals effectively?
  • To use Forex trading signals effectively, you must integrate them into a well-defined trading plan. Consider factors like risk management, trading timeframes, and market conditions.

    • Follow the signals provided by trusted sources.

    • Combine with technical indicators like MACD or RSI for more confirmation.

    • Always use a Stop Loss to limit potential losses.

What are the most popular Currency Pairs for Forex Trading?
  • The most popular Forex currency pairs include:These pairs offer higher liquidity and are ideal for both beginners and experienced traders.

    • EUR/USD (Euro/US Dollar)

    • GBP/USD (British Pound/US Dollar)

    • USD/JPY (US Dollar/Japanese Yen)

    • AUD/USD (Australian Dollar/US Dollar)

How does the RSI indicator work in Forex trading?
  • The Relative Strength Index (RSI) measures the speed and change of price movements on a scale from 0 to 100.

    • An RSI above 70 signals that the asset might be overbought.

    • An RSI below 30 suggests that it might be oversold.

    • Traders use this indicator to identify potential reversal points.

What is the significance of a Stop Loss in Forex trading?
  • A Stop Loss is a risk management tool used to prevent further loss in a trade by automatically closing the position once it reaches a predetermined loss level.

    • It helps protect capital.

    • It's an essential tool for limiting emotional decisions during volatile market conditions.

What role do economic events play in Forex trading?
  • Economic events like Non-Farm Payroll reports, Interest Rate Decisions, and GDP Growth can significantly impact currency values. Traders often watch these events closely as they can trigger large price movements in the Forex market.

    • Interest rate decisions by central banks can lead to currency appreciation or depreciation.

    • Non-Farm Payroll data impacts the strength of the US Dollar.

What is the best strategy for using Forex trading signals with indicators?
  • The best strategy is to combine Forex trading signals with complementary indicators like Bollinger Bands, MACD, or Fibonacci Retracement to confirm entry and exit points.

    • Use signals in conjunction with chart patterns like Head and Shoulders or Double Top to improve accuracy.

    • Ensure you apply the strategy across different timeframes for a more robust approach.

How can I manage risk while trading with Forex signals?
  • Effective risk management while using Forex signals involves setting clear Stop Loss and Take Profit levels, calculating risk/reward ratios, and adjusting position sizes based on account size.

    • Keep your risk/reward ratio at a favorable level (e.g., 1:2 or higher).

    • Use position sizing techniques to control your exposure to any single trade.

    • Be aware of your Maximum Drawdown and Risk Tolerance when implementing these strategies.