In the world of forex trading, having a robust strategy is critical. But what exactly separates successful traders from the rest? One crucial element is how traders approach market analysis. With so many different methods available, it can be challenging to determine which ones are the most reliable and effective. The two primary categories of analysis are technical analysis and fundamental analysis, each offering a distinct lens through which traders can assess the forex market. While both methods have their strengths and weaknesses, understanding how they differ and how to use them in tandem can make a world of difference to your trading success in 2025.
But why should you care about these analysis methods? Simply put, they help traders interpret market movements, identify trends, and ultimately make informed decisions about when to buy and sell currencies. In this article, we'll dive into the most effective analysis methods for forex trading, providing a detailed breakdown of both technical and fundamental approaches, their pros and cons, and how they fit into the trading landscape of 2025.

Table of Contents:
What is Technical Analysis? An In-Depth Look at Charts and Indicators
Fundamental Analysis in Forex: The Power of Economic Data and News
How to Combine Technical and Fundamental Analysis for Better Trading Decisions
The Role of Sentiment Analysis in Forex Trading
Advanced Technical Indicators for Forex in 2025: Are They Worth the Hype?
The Impact of Global Events on Currency Movements: A Case Study
Risk Management and Analysis Methods: How to Protect Your Capital
Choosing the Right Analysis Method for Your Trading Style
The Future of Forex Analysis: What Will 2025 Bring?
1. What is Technical Analysis? An In-Depth Look at Charts and Indicators
Technical analysis is the art of interpreting price charts, patterns, and indicators to predict future price movements. But let’s be real—while the theory sounds simple, the execution can be far more complex. At its core, technical analysis assumes that all information about a currency is reflected in its price. By analyzing past price movements and volumes, traders attempt to forecast where prices will head next.
So, how does this work in practice? Well, traders look for patterns in charts, such as head-and-shoulders, triangles, and flags, which provide clues about potential price direction. Key technical indicators like the Moving Average Convergence Divergence (MACD), Relative Strength Index (RSI), and Bollinger Bands help traders understand momentum, volatility, and overbought or oversold conditions.
As we approach 2025, these tools are becoming more sophisticated, thanks to AI and machine learning algorithms. But despite all the new technology, the core principles remain unchanged: identify trends, find entry and exit points, and trade accordingly.
Practical Tip: As a beginner, you might want to start with simple moving averages and RSI. They’re easy to understand and are highly effective in various market conditions.
2. Fundamental Analysis in Forex: The Power of Economic Data and News
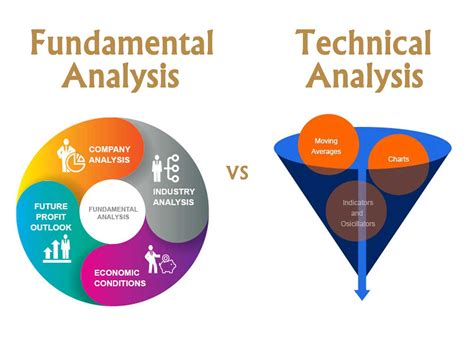
If technical analysis focuses on market behavior, then fundamental analysis zooms in on the forces driving those behaviors. Rather than looking at past price data, fundamental analysis delves into the underlying economic and political conditions that influence a country’s currency.
At the heart of this method is economic data: GDP growth, inflation rates, unemployment figures, and more. News events, including interest rate decisions by central banks, political stability, and global trade issues, also play a significant role. For example, when the Federal Reserve raises interest rates, the U.S. dollar often strengthens as investors move their capital into higher-yielding assets.
In 2025, understanding the intricacies of global economic policies will be more important than ever. Given the fast pace of digital information and the global interconnectedness of markets, forex traders need to stay ahead of market-moving news. But, beware—economic data can be volatile, and its impact on the forex market is often unpredictable.
Practical Tip: A reliable news source and an economic calendar are fundamental tools for any trader using fundamental analysis. Keep track of key events, and be ready to adjust your strategy accordingly.

3. How to Combine Technical and Fundamental Analysis for Better Trading Decisions
For many experienced traders, the real power comes from blending both technical and fundamental analysis. While each method has its strengths, combining them can provide a more comprehensive view of the market.
Imagine you’re analyzing a currency pair like EUR/USD. The technical analysis might show that the pair is in an uptrend, with the RSI indicating that the currency is not yet overbought. But before entering the trade, you check the economic calendar and notice that the European Central Bank is scheduled to announce a change in interest rates next week. This news could have a significant impact on the euro’s value, which may override your technical analysis.
By marrying the two methods, traders can not only spot trends but also understand the bigger picture. Technical analysis might give you a solid entry and exit strategy, but fundamental analysis can confirm whether that trade aligns with the underlying economic environment.
Practical Tip: Consider entering trades when both the technical and fundamental indicators align. For example, if both technical analysis and a positive economic forecast point to a strengthening currency, you’re in a good position to trade.
4. The Role of Sentiment Analysis in Forex Trading
Sentiment analysis in forex trading is like reading the room at a party. It’s all about understanding how market participants—traders, investors, and even central banks—feel about a particular currency or economy.
In 2025, sentiment analysis tools have become increasingly sophisticated. They track social media posts, news articles, and trading forums to gauge market sentiment. For instance, if a large number of traders are talking about buying a specific currency, this could indicate bullish sentiment, which might signal an opportunity for you to join in.
But why is sentiment analysis so crucial? Because sometimes, price movements are driven more by emotions than by hard data. Traders may rush to buy or sell based on rumors, fear, or excitement, which can create massive volatility. By tapping into these emotional shifts, sentiment analysis helps traders predict price movements driven by market psychology.
Practical Tip: Use sentiment analysis as a complementary tool. If your technical and fundamental analyses align with strong bullish sentiment, you may have a higher chance of success.
5. Advanced Technical Indicators for Forex in 2025: Are They Worth the Hype?
Advanced technical indicators have been gaining popularity in recent years, especially as technology evolves. Indicators like Fibonacci retracements, Elliott Wave theory, and Ichimoku clouds promise to offer deeper insights into market behavior. But as we move into 2025, the question remains: Are they really worth the hype?
The answer depends on your trading style. For example, Fibonacci retracements are widely used to predict potential support and resistance levels based on previous price movements. On the other hand, Elliott Wave theory focuses on identifying cyclical patterns in the market, which can be particularly useful for long-term traders.
However, advanced indicators can be overwhelming for beginners. They require a deep understanding and significant practice to master. So, before diving into the world of complex indicators, it’s important to ask yourself: “Do I really need this, or am I just complicating things?”
Practical Tip: Stick to one or two advanced indicators that align with your strategy. Master them before branching out into more complex methods.

6. The Impact of Global Events on Currency Movements: A Case Study
Global events can have a huge impact on currency movements. Whether it’s a natural disaster, a sudden political crisis, or a global pandemic like COVID-19, unexpected events can lead to sharp fluctuations in the forex market. In 2025, geopolitical tensions and trade wars are expected to continue influencing currency values in unpredictable ways.
For example, in the case of the Brexit vote, the British pound plummeted as traders reacted to the uncertainty surrounding the UK's departure from the European Union. Similarly, when the COVID-19 pandemic first hit, currencies across the world faced unprecedented volatility as countries scrambled to respond to the crisis.
For forex traders, the key is to stay informed about global events and to understand how they might impact market sentiment. By staying ahead of the news, traders can adapt their strategies quickly, taking advantage of short-term opportunities created by major global shifts.
Practical Tip: Set up alerts for global events and be ready to act swiftly if they threaten to impact your positions.
Conclusion: The Future of Forex Trading Analysis
The world of forex trading is constantly evolving. As we look ahead to 2025, it’s clear that both technical and fundamental analysis will continue to play pivotal roles in shaping market outcomes. While technology and sentiment analysis are opening new doors, the fundamentals of sound analysis remain unchanged: understand market dynamics, stay informed, and keep learning.
Ultimately, the best approach to forex trading analysis depends on your individual style, risk tolerance, and trading goals. Whether you’re a technical wizard or a fundamental guru, the key is to remain adaptable. The market won’t wait for you to catch up—stay ahead of the curve, and let your analysis methods drive your success.
References:
“Understanding Technical Analysis: The Basics” by Mark J. P. Johnson.
“The Impact of Global News on Forex Markets” by Laura D. Wells.
“The Rise of Sentiment Analysis in Forex Trading” by Richard Blake.


