Tìm hiểu cách giao dịch Forex với Hướng dẫn cơ bản dành cho người mới bắt đầu mới nhất của chúng tôi. Khám phá các cặp tiền tệ là gì, chênh lệch giá, lô và pip trong Forex, tìm hiểu về quản lý tiền, những sai lầm cần tránh và hơn thế nữa! Nhận thông tin chi tiết từ các nhà giao dịch chuyên nghiệp và tìm hiểu tất cả những điều cơ bản mà mọi người mới bắt đầu nên biết để giao dịch thành công trên thị trường trao đổi tiền tệ (FX).
Tìm hiểu giao dịch ngoại hối - Hướng dẫn cho người mới bắt đầu
Cặp tiền tệ là gì< /span>

Một cặp tiền tệ là sự kết hợp của hai loại tiền tệ khác nhau, chẳng hạn như đồng euro và đô la Mỹ, được biểu thị bằng EUR/USD.
Các nhà giao dịch mua EUR/USD suy đoán rằng giá trị của đồng euro sẽ tăng so với đồng đô la. Các nhà giao dịch bán EUR/USD suy đoán rằng đồng đô la sẽ tăng giá trị so với đồng euro.
Các cặp tiền tệ chính, các cặp tiền tệ phụ và các cặp tiền tệ lạ là gì
Các cặp tiền tệ chính được giao dịch nhiều nhất trên thế giới các cặp tiền tệ, trong đó EUR/USD là phổ biến nhất.
7 cặp tiền tệ chính là:
| Pair | Currencies | Nickname |
|---|---|---|
| EUR/USD | Euro (€) vs. US dollar ($) | Fiber |
| USD/JPY | US dollar ($) vs. Japanese yen (¥) | Gopher |
| GBP/USD | British pound (£) vs. US dollar ($) | Cable |
| USD/CHF | US dollar ($) vs. Swiss franc | Swissie |
| AUD/USD | Australian dollar (A$) vs. US dollar ($) | Aussie |
| USD/CAD | US dollar ($) vs. Canadian dollar (C$) | Loonie |
| NZD/USD | New Zealand dollar (NZ$) vs. US dollar ($) | Kiwi |
Các cặp tiền tệ phụ ít phổ biến hơn các cặp tiền tệ chính và không bao gồm Đô la Mỹ (USD). Ví dụ về các cặp tiền tệ nhỏ là EUR/CHF và GBP/JPY. Các cặp tiền tệ nhỏ có tính thanh khoản rất cao, nhưng không lỏng bằng các cặp tiền chính.
Các cặp tiền tệ ngoại lai bao gồm các loại tiền tệ từ các nền kinh tế mới nổi, chẳng hạn như USD/RUB (Rúp Nga) hoặc USD/MXN (Peso Mexico). Các loại tiền ngoại lai dễ biến động hơn và kém thanh khoản hơn các cặp tiền tệ nhỏ, dẫn đến chi phí giao dịch cao hơn.
Điều kiện thị trường
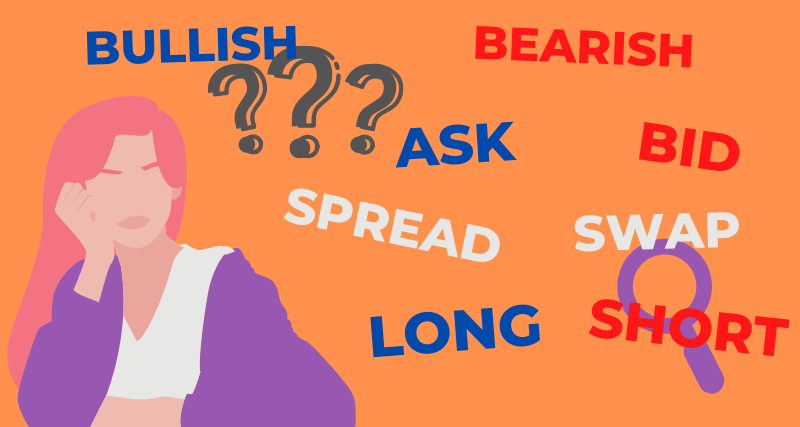
Hãy xem xét các thuật ngữ Forex quan trọng nhất:
Giá bán và giá thầu - Giá bán là giá mà công cụ có thể mua được và giá Bid là giá mà công cụ có thể được bán. Giá bán luôn cao hơn giá mua nên mọi giao dịch ban đầu đều lỗ.
Chênh lệch tỷ giá hối đoái là chênh lệch giữa giá bán và giá mua. Khoản chênh lệch này là nơi các ngân hàng, nhà môi giới và nhà giao dịch kiếm được lợi nhuận, ngoài tiền hoa hồng được tính (nếu có).
Tỷ giá hoán đổi hoặc tỷ lệ tái đầu tư là lãi suất được cộng hoặc trừ để giữ trạng thái tiền tệ mở qua đêm. Tỷ giá hoán đổi âm hoặc dương được tính dựa trên việc vị thế được mua hay bán và chênh lệch lãi suất đối với từng loại tiền tệ.
Các vị thế bán và mua đề cập đến việc bán hoặc mua. Khi bạn bán, bạn vào một vị thế bán. Khi bạn mua, bạn vào một vị trí dài.
Thị trường giá xuống và thị trường giá lên đề cập đến xu hướng thị trường là tăng hay giảm một cách thuyết phục. Trong thị trường giá xuống, giá giảm, trong khi ở thị trường giá lên, giá tăng.
CFD là tên viết tắt của Hợp đồng chênh lệch. Những sản phẩm này cho phép nhà giao dịch kiếm lời hoặc thua lỗ dựa trên chênh lệch giữa giá vào và ra của giao dịch mà không có quyền sở hữu tài sản cơ bản. CFD rất phổ biến trong Forex, cổ phiếu, chỉ số và hàng hóa.
Điểm (tăng giá) là gì
< p >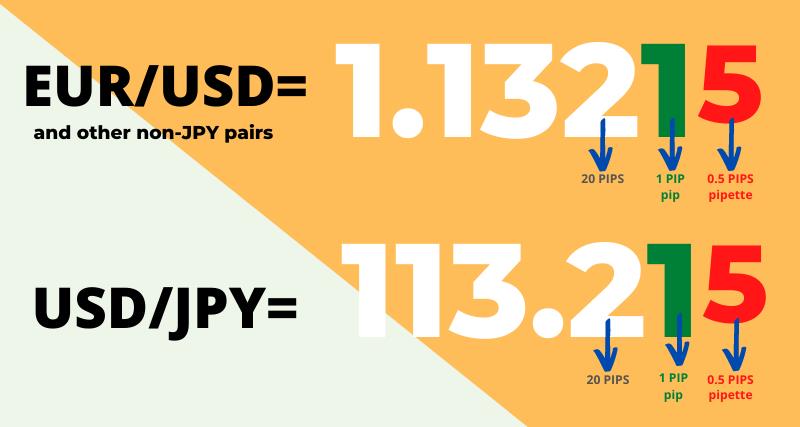
A pip trong Forex đề cập đến sự thay đổi giá nhỏ nhất có thể được thực hiện trên một cặp tiền tệ, ngoại trừ dấu thập phân hoặc "pipet".
Đối với hầu hết các cặp tiền tệ, 1 pip là 0,0001; đối với các cặp tiền tệ có đồng Yên Nhật, chẳng hạn như USD/JPY, 1 pip là 0,01. Khi giao dịch kim loại, 1 pip là 0,01 đối với vàng và bạc.
Khi EUR/USD tăng từ 1,0925 lên 1,0926, mức thay đổi là 1 pip. Sử dụng mức giá 5 chữ số, nếu EUR/USD chuyển từ 1,09255 lên 1,09260 thì mức tăng sẽ là nửa pip.
Chênh lệch là gì (chi phí giao dịch)
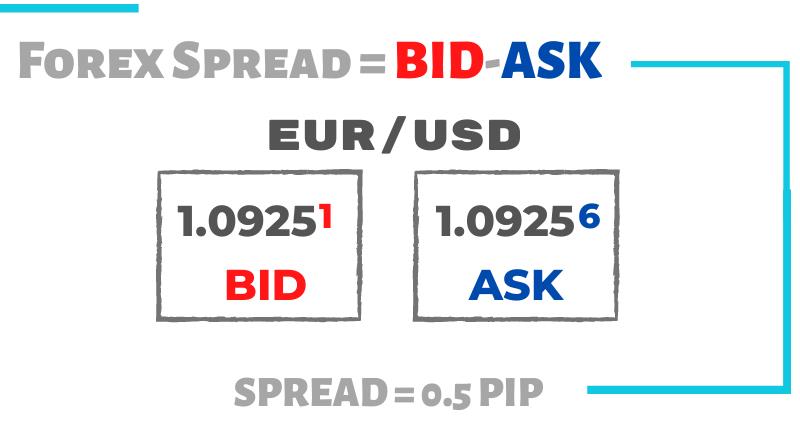
Sự chênh lệch của các công cụ tài chính (chứng khoán, ngoại hối, v.v.) là sự chênh lệch giữa giá bán và giá mua. Sự chênh lệch là một chi phí giao dịch, nếu có hoa hồng. Do chênh lệch giá, mọi giao dịch đều bắt đầu bằng thua lỗ vì bạn mua ở giá chào bán và bán ở giá chào mua.
Ví dụ về chênh lệch EUR/USD:
| Giá thầu | Hỏi giá | Lan truyền | |
|---|---|---|---|
| Trích dẫn 4 chữ số | 1.0928< /td> | 1.0929 | 0,0001 = 1 Pip |
| Trích dẫn 5 chữ số | 1.09252 | 1.0925< strong>7 | 0,00005 = 0,5 Pip |
Lô là gì (quy mô giao dịch)
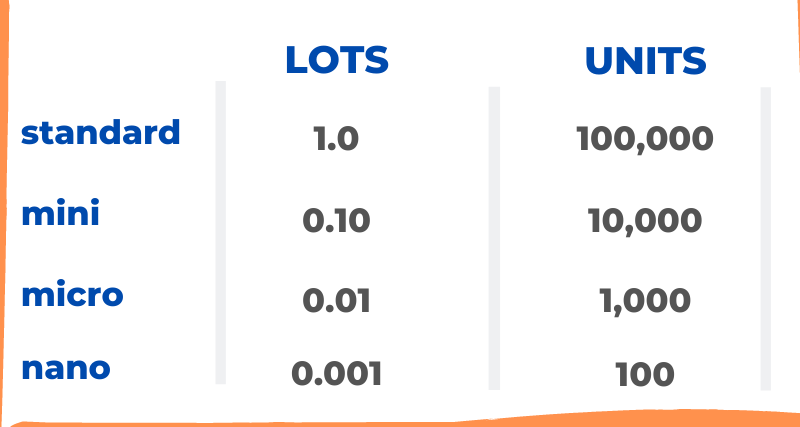
Trong giao dịch ngoại hối, số lượng lô xác định quy mô giao dịch hoặc đơn vị tiền tệ được mua hoặc bán theo số lượng buôn bán. Một lô tiêu chuẩn là 100.000 đơn vị tiền tệ cơ sở.
Hầu hết các nhà môi giới cho phép giao dịch theo lô thập phân thấp nhất là 0,01 hoặc ít hơn. Lô phân số đôi khi được gọi là lô mini, micro và nano. Vui lòng tham khảo hình ảnh trên để so sánh kích thước và đơn vị.
Đòn bẩy và ký quỹ là gì
< span jsaction="mouseup:Sxi9L,BR6jm; mousedown:qjlr0e" jsname="jqKxS">Đòn bẩy cho phép nhà giao dịch kiểm soát các vị thế lớn hơn với ít tiền hơn (ký quỹ), do đó tăng lợi nhuận và thua lỗ lên rất nhiều. Giao dịch đòn bẩy còn được gọi là giao dịch ký quỹ. Đòn bẩy làm tăng lợi nhuận và thua lỗ tiềm năng. Ví dụ: nếu bạn mua EUR/USD ở mức 1,0000 mà không có đòn bẩy thì để thua lỗ toàn bộ, giá sẽ phải về 0 hoặc lên 2,0000 để tăng gấp đôi khoản đầu tư của bạn. Nếu bạn giao dịch với đòn bẩy tối đa 100:1, biến động giá giảm 100 lần sẽ tạo ra mức lãi hoặc lỗ tương tự. Ký quỹ là số tiền mà nhà giao dịch phải đầu tư để mở một vị thế mới. Đây không phải là phí hay chi phí và sẽ được hoàn lại sau khi giao dịch hoàn tất. Mục đích là để bảo vệ người môi giới khỏi thua lỗ. Khi thua lỗ khiến tỷ suất lợi nhuận của nhà giao dịch giảm xuống dưới tỷ lệ phần trăm dừng lỗ được xác định trước, nhà môi giới sẽ tự động đóng một hoặc tất cả các vị thế mở. Cảnh báo lệnh gọi ký quỹ từ các nhà môi giới có thể được đưa ra hoặc không được đưa ra trước khi thanh lý như vậy.
Đòn bẩy hoạt động như thế nào span>
Sử dụng đòn bẩy 100:1, nhà giao dịch có thể mở một vị thế lớn hơn 100 lần so với khi không có đòn bẩy. Ví dụ: nếu mua 0,01 lô EUR/USD thường có giá 1.000 USD và nhà môi giới cung cấp đòn bẩy 100:1 thì nhà giao dịch chỉ phải đặt 10 USD làm tiền ký quỹ. Tất nhiên, các nhà giao dịch có thể sử dụng ít đòn bẩy như họ muốn.
Hãy cẩn thận: Đòn bẩy cao hơn có nghĩa là rủi ro cao hơn. Hầu hết các chuyên gia sử dụng đòn bẩy rất thấp hoặc hoàn toàn không có đòn bẩy và rủi ro ở mức phần trăm vừa phải cho mỗi giao dịch.
Để biết thêm thông tin về đòn bẩy, hãy xem bài viết của chúng tôi Đòn bẩy trong Forex là gì và cách sử dụng nó.
Để tính toán yêu cầu ký quỹ dựa trên quy mô giao dịch và đòn bẩy, hãy sử dụng Công cụ tính ký quỹ Forex tiện dụng của chúng tôi.
Quản lý quỹ là gì
Quản lý quỹ là một bộ quy tắc giúp bảo vệ vốn của bạn và cuối cùng là giúp bạn phát triển tài khoản giao dịch của mình.
Quy tắc quan trọng nhất là chỉ mạo hiểm một phần nhỏ tài khoản của bạn tại một thời điểm. Bằng cách này, bạn sẽ có thể chịu đựng được chuỗi thua lỗ không thể tránh khỏi. Theo nguyên tắc chung, nhiều nhà giao dịch cân nhắc rủi ro từ 2% trở xuống cho mỗi giao dịch.
Cái gì là phản hồi Rút vốn
Giảm vốn là sự giảm vốn từ mức cao nhất của cổ phiếu xuống mức thấp tiếp theo, thường được biểu thị bằng phần trăm. Mức rút tiền tối đa đề cập đến mức rút tiền lịch sử tối đa mà tài khoản đã trải qua.
Là gì Biểu đồ nến
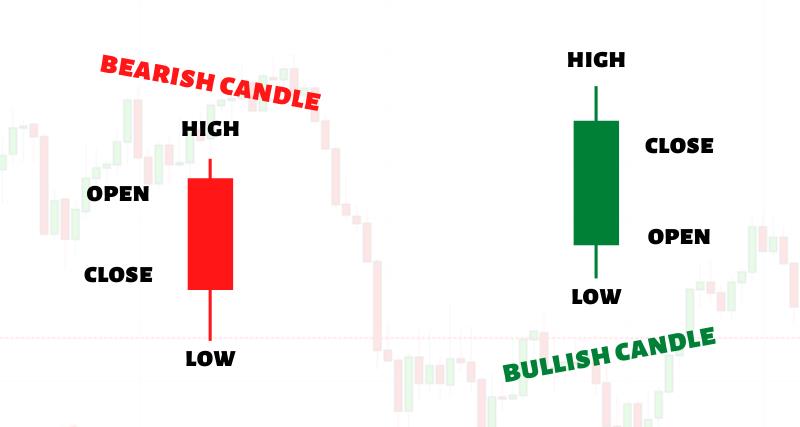
Chân nến bao gồm các phần thân rắn và bấc trên và dưới tượng trưng cho mức mở, cao, thấp và đóng (OHLC) trong khoảng thời gian xác định từ 1 phút đến 1 tháng .
Nến có màu đỏ nếu giá giảm và đóng cửa ở mức thấp hơn; nến có màu xanh nếu giá tăng và đóng cửa ở mức cao hơn.
Để xem hoạt động của biểu đồ nến, hãy xem biểu đồ Forex miễn phí của chúng tôi.
Để biết thêm thông tin về các mẫu hình nến, hãy xem bài viết đầy đủ của chúng tôi Các mẫu hình nến Forex: Hướng dẫn đầy đủ.
Phân tích kỹ thuật là gì
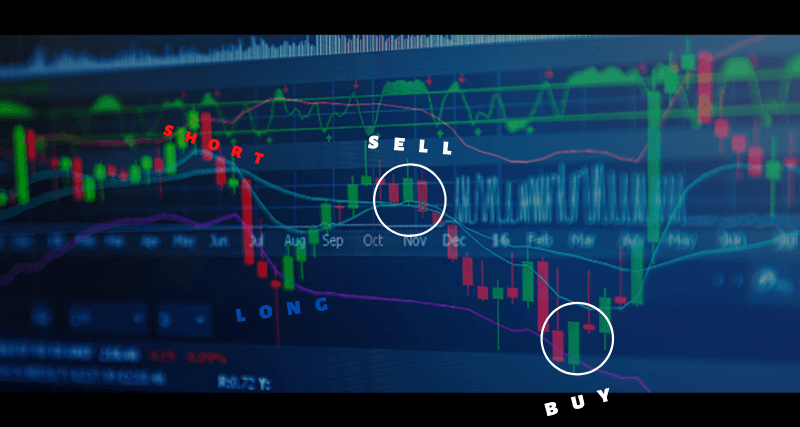
Phân tích kỹ thuật là nghiên cứu về hành động giá để xác định nên mua hay bán một tài sản và ở mức giá nào.
Nó được thực hiện trực tiếp trên biểu đồ giá tài sản với sự trợ giúp của các chỉ báo kỹ thuật như RSI hoặc MACD hoặc các công cụ khác như hỗ trợ/kháng cự, Fibonacci thoái lui Rút hoặc kết hợp.
Những nhà giao dịch thành công chứng minh rằng "xu hướng là bạn của bạn" và "đừng cố đi ngược lại xu hướng". Bạn sẽ thành công hơn khi giao dịch theo xu hướng dài hạn và tránh xa những thị trường không có xu hướng rõ ràng.
Khi một nhà phân tích đã xác định được một xu hướng, bước tiếp theo là cố gắng xác định xu hướng đó có thể đi xa đến đâu hoặc khi nào nó có thể cạn kiệt để đánh giá liệu nó có đại diện cho xu hướng đó hay không. một cơ hội giao dịch. Ý tưởng là mua ở mức giá thấp nhất trong xu hướng tăng và bán ở mức giá cao nhất trong xu hướng giảm hoặc ngược lại.
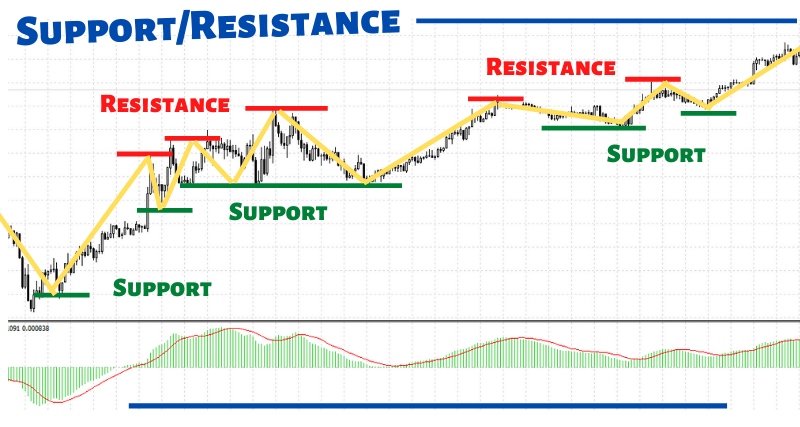
Một xu hướng bao gồm các xung zigzag và các mức thoái lui, còn được gọi là các mức hỗ trợ và kháng cự. Hỗ trợ là mức giá mà các nhà giao dịch sẵn sàng mua một tài sản, trong khi mức kháng cự là mức giá mà họ sẵn sàng bán. Các mức cũ mạnh hơn các mức mới và khi một mức bị phá vỡ, nó sẽ đảo ngược và mức hỗ trợ cũ trở thành mức kháng cự mới và ngược lại.
什么是多时间框架分析
Phân tích kỹ thuật phải luôn được xem từ nhiều khung thời gian, từ biểu đồ hàng tháng (mỗi nến biểu thị một tháng) đến 1 giờ. Các biểu đồ khung thời gian cao hơn như hàng tuần và hàng tháng có thể xác nhận các xu hướng chính, trong khi các biểu đồ khung thời gian thấp hơn như hàng ngày và 4 giờ có thể giúp xác định các cơ hội gia nhập tốt nhất.
Lịch kinh tế Dữ liệu và Sự biến động
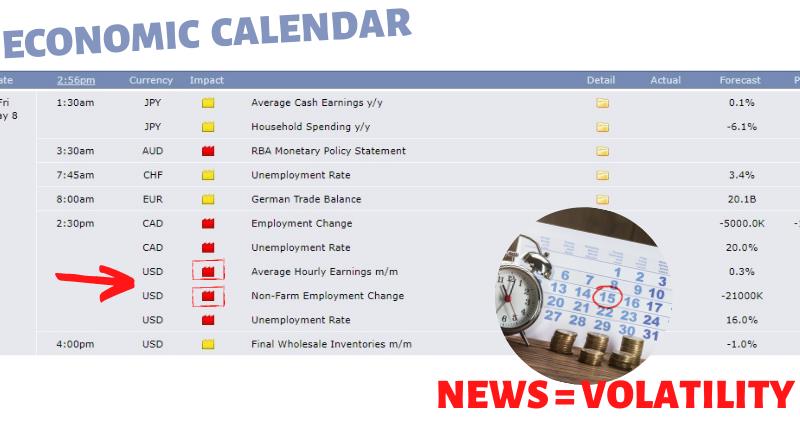
Chính phủ và các cơ quan khác trên thế giới liên tục đo lường và báo cáo dữ liệu và tăng trưởng kinh tế, đồng thời lịch kinh tế đáng tin cậy là điều mà các nhà giao dịch phải quan tâm các công cụ chính.
Sau khi công bố dữ liệu việc làm quan trọng như bảng lương phi nông nghiệp của Hoa Kỳ, sự biến động của các cặp tiền tệ như EUR/USD có thể gây ra biến động lớn và chênh lệch giá. Ví dụ: nếu giá chênh lệch 50 pip, điều đó có nghĩa là không có thanh khoản trong phạm vi 50 pip đó và bạn tạm thời không thể thoát giao dịch hoặc thực hiện giao dịch mới.
Mở giao dịch trong thời điểm có tin tức kinh tế hoặc địa chính trị quan trọng có thể gặp rủi ro. Biến động cao có thể xảy ra trong vài giây sau các sự kiện tin tức như vậy.
Trước khi dữ liệu kinh tế được công bố, các nhà phân tích cố gắng dự đoán kết quả và đưa ra ước tính đồng thuận. Biến động cao có thể xảy ra nếu dữ liệu quan trọng và giá trị được báo cáo khác biệt đáng kể so với ước tính.
Tìm hiểu cách sử dụng lịch kinh tế
Vào đầu mỗi tuần giao dịch, hãy nhớ kiểm tra lịch kinh tế để biết các sự kiện có tác động trung bình và cao sắp tới bằng cách sử dụng các biểu tượng tác động bên cạnh tên sự kiện. Các sự kiện có tác động cao sử dụng biểu tượng màu đỏ, trong khi các sự kiện có tác động trung bình sử dụng biểu tượng màu cam.
Giá trị "Tác động" trên lịch cho biết khả năng tác động đến thị trường của báo cáo. Nếu dữ liệu được công bố trong báo cáo kinh tế khác biệt đáng kể so với dự báo hoặc kỳ vọng thì có thể có tác động. Ngược lại, nếu dữ liệu đúng như mong đợi thì báo cáo có thể có ít hoặc không có tác động.
Các nhà giao dịch thường kiểm tra lịch để biết các sự kiện kinh tế sắp tới vì một trong hai lý do. Đầu tiên là tránh giao dịch công khai trong thời kỳ có khả năng biến động cao. Thứ hai là sử dụng sự biến động này để tìm điểm vào và ra tốt trong các giao dịch mới hoặc hiện tại.
Trên hầu hết các lịch kinh tế Forex, bạn sẽ thấy những giá trị quan trọng sau.
Giá trị tháng trước - Hiển thị kết quả của tháng trước, giá trị này có thể thay đổi do tháng trước đôi khi được điều chỉnh. Những bất ngờ như vậy có thể gây ra biến động.
Dự báo hoặc đồng thuận - Hiển thị dự báo dựa trên sự đồng thuận của các nhà phân tích kinh tế.
Giá trị thực tế - Hiển thị các giá trị được báo cáo thực tế, có thể gây ra biến động nếu chúng khác biệt đáng kể so với dự báo.
Tác động - Tác động tiềm ẩn được báo cáo được biểu thị bằng biểu tượng màu bên cạnh tên sự kiện. Màu đỏ biểu thị tác động cao và màu cam biểu thị tác động trung bình.
Hãy kiểm tra lịch kinh tế của chúng tôi thường xuyên để đảm bảo bạn luôn biết về các sự kiện có tác động trung bình và cao sắp tới.
Các loại lệnh giao dịch có sẵn trong ngoại hối

Lệnh thị trường là lệnh mua hoặc bán ngay lập tức ở mức giá sẵn có tiếp theo. Lệnh thị trường diễn ra nhanh chóng; tuy nhiên, mức giá khả dụng tiếp theo có thể khác biệt đáng kể so với mức giá hiện tại mà nhà giao dịch đang xem xét, đặc biệt là trong các giai đoạn biến động. Điều này được gọi là trượt. Đặt lệnh thị trường trong thời gian biến động hoặc thanh khoản kém có thể dẫn đến độ trượt giá cao.
Lệnh giới hạn là lệnh mua hoặc bán được giới hạn ở một mức giá xác định hoặc tốt hơn. Không giống như lệnh thị trường, chúng cung cấp quyền kiểm soát hoàn toàn đối với giá thực hiện. Tất nhiên, nếu giá lệnh không có sẵn tại thời điểm thực hiện thì lệnh sẽ không được thực hiện.
Có những loại lệnh chờ nào?
Lệnh chờ được thiết lập để thực hiện khi giá đạt đến một mức nhất định trong tương lai. Chúng có thể đặt ngày hết hạn hoặc hoạt động tốt cho đến khi bị hủy (GTC). Tùy thuộc vào loại, một số thực hiện dưới dạng lệnh giới hạn và một số thực hiện dưới dạng lệnh thị trường.
Chốt lời là một lệnh chờ xử lý, lệnh này sẽ đóng giao dịch sau khi giao dịch có lãi đạt đến mức giá đã đặt.
Trailing-Stop là lệnh chờ xử lý được sử dụng để đóng giao dịch sau khi đạt được một số điểm nhất định tính từ mức giá cao nhất.
Dừng lỗ là lệnh chờ xử lý, kết thúc giao dịch ở mức giá khả dụng tiếp theo sau khi giao dịch thua lỗ đạt đến mức giá đã đặt.
Buy-Stop là lệnh chờ được đặt trên giá hiện tại để mua khi giá tăng cao hơn giá hiện tại.
Dừng bán là lệnh thị trường có giá trị thấp hơn giá hiện tại và bán khi giá giảm xuống dưới giá hiện tại.
Buy-Limit là lệnh giới hạn chờ xử lý dưới mức giá hiện tại để mua khi giá giảm xuống mức giá hiện tại.
Giới hạn bán là lệnh giới hạn được đặt cao hơn giá hiện tại để bán khi giá tăng lên mức giá hiện tại.
Lệnh giới hạn dừng hoạt động tương tự như lệnh dừng ngoại trừ việc chúng thực thi dưới dạng lệnh giới hạn.
Giao dịch ngoại hối có những rủi ro gì< /h2>Rủi ro lớn nhất mà bất kỳ nhà giao dịch mới nào cũng phải đối mặt là giao dịch mà không có đủ kiến thức và kinh nghiệm, thường dẫn đến thua lỗ rất lớn.
Sử dụng đòn bẩy cao để thực hiện các giao dịch lớn có thể khiến tài khoản giao dịch nhanh chóng về 0 hoặc thậm chí trở nên âm nếu nhà môi giới không cung cấp biện pháp bảo vệ số dư âm.
Ngoài ra, nếu cơ quan quản lý của nhà môi giới không cung cấp bảo hiểm tiền gửi, nhà môi giới có thể thất bại và bạn có thể mất khoản đầu tư của mình.
Nền tảng giao dịch MetaTrader là gì
< img src="/ueditor/php/upload/image/20230413/1681371873893379.png" alt="MetaTrader" width="800" Height="427"/>
MetaTrader là gì nhất nền tảng giao dịch ngoại hối phổ biến của bên thứ ba, được cung cấp bởi hầu hết các nhà môi giới. Với các biểu đồ tích hợp và nhiều chỉ báo kỹ thuật, nó cho phép người dùng dễ dàng giao dịch Forex và tùy thuộc vào nhà môi giới, CFD trên cổ phiếu và chỉ số, hàng hóa và tiền điện tử.
Sử dụng ngôn ngữ lập trình đơn giản tương tự như C++, bạn có thể dễ dàng xây dựng robot giao dịch tự động (EA) được gọi là "cố vấn chuyên gia" trong trình soạn thảo ngôn ngữ MQL, Chỉ báo kỹ thuật và kịch bản. Bạn thậm chí có thể kiểm tra lại Expert Advisor của mình về dữ liệu giá lịch sử bằng cách sử dụng trình kiểm tra chiến lược tích hợp sẵn.
Nhiều tiện ích bổ sung này có thể được tải xuống miễn phí hoặc mua trên nhiều trang web khác nhau.
Thời gian tốt nhất trong ngày để giao dịch ngoại hối
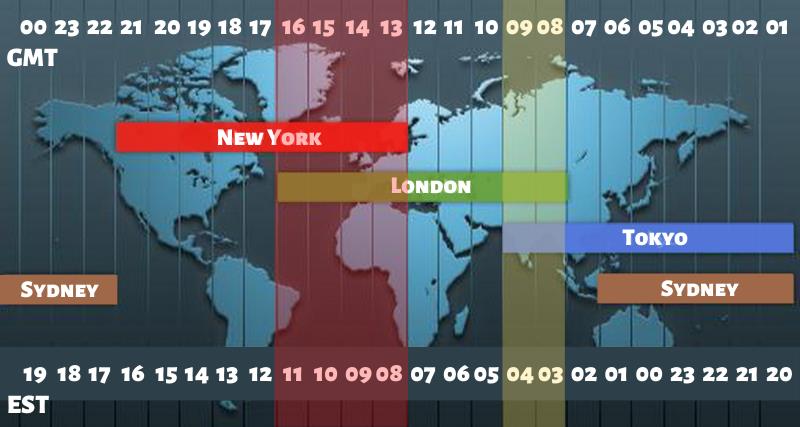
Thị trường ngoại hối toàn cầu 24 giờ có thể được chia đại khái thành 4 phiên giao dịch, tương ứng với thời điểm các trung tâm tài chính lớn tiến hành kinh doanh và báo cáo dữ liệu kinh tế.
Bắc Mỹ - New York, Hoa Kỳ
Châu Á - Tokyo, Nhật Bản
Châu Á - Tokyo, Nhật Bản
p>
Châu Á Thái Bình Dương - Sydney, Úc
Châu Âu - Luân Đôn, Vương quốc Anh
Giao dịch Trong những khoảng thời gian có khối lượng giao dịch cao nhất, giá cả thay đổi nhanh chóng có nhiều khả năng tạo ra cơ hội và chênh lệch giá ở mức thấp nhất.
Thời gian giao dịch sôi động nhất thường là 8:00 - 12:00 giờ New York. Khoảng thời gian 4 giờ mà London và New York trùng nhau thường được coi là giờ giao dịch sôi động nhất để giao dịch ngoại hối. Sydney và Tokyo cũng trùng nhau trong khoảng thời gian từ 24:00-6:00 GMT.
Nếu bạn muốn biết thêm về thời điểm tốt nhất và tồi tệ nhất để giao dịch, hãy xem bài viết của chúng tôi Thời điểm tốt nhất để giao dịch Forex là gì.
Cách mở tài khoản demo ngoại hối và bắt đầu thực hành
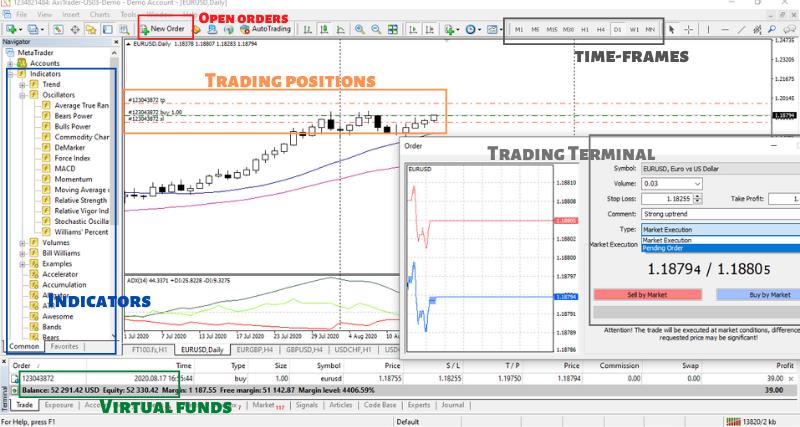
Tài khoản giao dịch demo cho phép bạn thực hành giao dịch mà không có nguy cơ mất tiền thật. Đây là nơi tốt nhất để người mới bắt đầu tìm hiểu những điều cơ bản, chẳng hạn như cách sử dụng nền tảng giao dịch, xác định khối lượng vị thế phù hợp, v.v. Cảm xúc đi kèm với giao dịch tiền thật khác với giao dịch thực tế, vì vậy khi người mới bắt đầu chuyển sang giao dịch tiền thật, họ vẫn nên tiếp tục.
Để mở tài khoản demo và bắt đầu thực hành giao dịch ngay lập tức, hãy xem bảng bên dưới để biết đường liên kết đến một số nhà môi giới phổ biến nhất trên thế giới.
Nhà môi giới Các quốc gia có sẵn Mở một tài khoản 
Thị trường ICHầu hết, ngoại trừ Hoa Kỳ Tài khoản demo miễn phí
Tài khoản trực tiếp 
XMHầu hết, ngoại trừ Hoa Kỳ Tài khoản demo miễn phí
Tài khoản trực tiếp 
IG Hoa KỳHoa Kỳ Tài khoản demo miễn phí
Tài khoản trực tiếp
Cách chọn nhà môi giới Forex tốt nhất
Khi chọn một nhà môi giới Forex mới, có một số điều quan trọng cần lưu ý xem xét yếu tố Chúng bao gồm bảo hiểm quy định và tiền gửi, giá cả, thực hiện và dịch vụ khách hàng.
Xem trang danh sách nhà môi giới Forex của chúng tôi và sử dụng các bộ lọc dựa trên hầu hết mọi tiêu chí bao gồm quy định, bảo hiểm tiền gửi, bảo vệ số dư âm, đòn bẩy, giá cả, xếp hạng của người dùng, xu tài khoản, v.v.) để tìm nhà môi giới tốt nhất cho bạn. Bạn cũng có thể trò chuyện trực tiếp hoặc gửi email cho chúng tôi để được trợ giúp thêm.
Những bài viết khác này cũng có thể hữu ích khi chọn nhà môi giới tốt nhất:
Tốt nhất Nhà môi giới ngoại hối năm 2020: Đánh giá của khách hàng
Nhà môi giới ngoại hối tốt nhất ở Hoa Kỳ
Làm thế nào để tìm nhà môi giới ngoại hối tốt nhất: 7 yếu tố chính cần xem xét
Những cân nhắc cuối cùng
Nhà giao dịch ngoại hối chuyên nghiệp là những cá nhân rất kỷ luật, thường xuyên giao dịch theo các quy tắc quản lý tiền và rủi ro được xác định trước. Mặc dù thị trường Forex có thể mang lại cơ hội kiếm thu nhập nhưng bạn nên dành thời gian và tích lũy kinh nghiệm cần thiết. Hãy có kỷ luật và tìm kiếm lời khuyên tài chính độc lập khi cần thiết.


Thị trường IC
Tài khoản trực tiếp

XM
Tài khoản trực tiếp

IG Hoa Kỳ
Tài khoản trực tiếp
Những cân nhắc cuối cùng
Nhà giao dịch ngoại hối chuyên nghiệp là những cá nhân rất kỷ luật, thường xuyên giao dịch theo các quy tắc quản lý tiền và rủi ro được xác định trước. Mặc dù thị trường Forex có thể mang lại cơ hội kiếm thu nhập nhưng bạn nên dành thời gian và tích lũy kinh nghiệm cần thiết. Hãy có kỷ luật và tìm kiếm lời khuyên tài chính độc lập khi cần thiết.


